Can AI models improve on the failures in predicting returns strictly from a practical point of view? In this paper, the possibilities are tested with a battery of AI models including linear regression, dimensional reduction methods, regression trees and neural networks. These machine learning models may be better equipped to address the multidimensional nature of stock returns when compared to traditional sorting and cross-sectional regressions used in factor research. The authors hope to overcome the drawbacks and confirm the results of traditional quant methods. As it turns out, those hopes are only weakly fulfilled by the MLM framework.
Predicting Returns with Machine Learning Across Horizons, Firms Size, and Time
- Nusret Cakici, Christian Fieberg, Daniel Metko and Adam Zaremba
- The Journal of Financial Data Science
- A version of this paper can be found here
- Want to read our summaries of academic finance papers? Check out our Academic Research Insight category.
What are the research questions?
- Do MLMs work better than traditional approaches to building factor strategies?
What are Academic Insights?
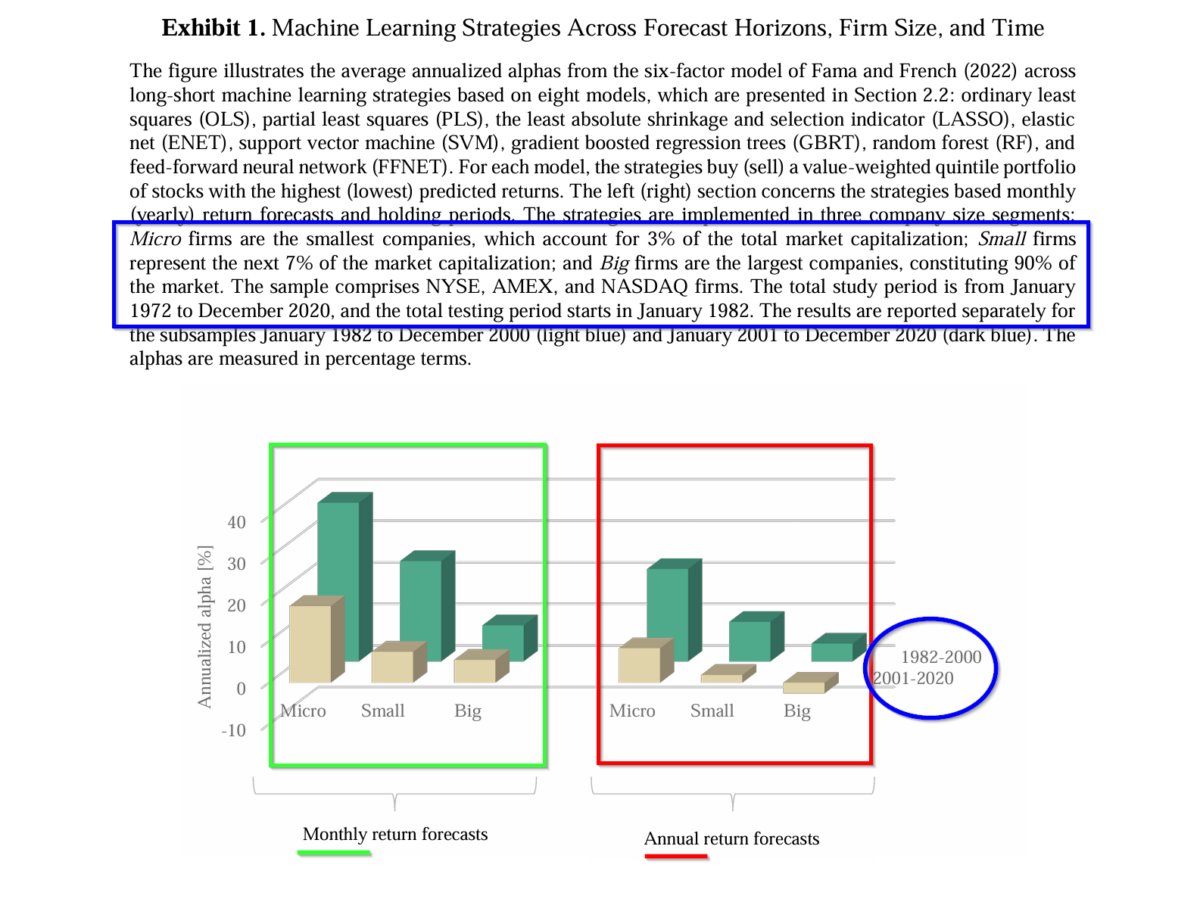
- NOT REALLY. The accuracy of the MLM predictions varies over the forecast horizon, the market cap of the universe of stocks and over time. See Exhibit 1 below.
- Forecast horizon: When MLMs are trained on predicting monthly or annual returns, the monthly returns win out, producing twice the excess returns at 10.18% to 19.23%. In contrast, return predictions obtained from portfolios based on annual data produce between 4.10% to 9.81% on a risk-adjusted basis. Obviously, the value added by using monthly returns is significant. The authors suggest the performance difference depends on the variables used to forecast either monthly or annual returns. Monthly return MLMs rely on market frictions like number of zero trading days and short-term reversal. Annual return MLMs rely on fundamentals like valuation, profitability, and investment.
- Size of the firm: The performance of MLMs in small and micro-cap universes exceeds their performance for large stocks. Much as the anomalies as originally discovered emanated from the very smallest stocks in the market while they were weak or nonexistent in the large cap market. MLMs produce similar results as cross-sectional regressions with respect to firm size. Monthly forecasts made from MLMs produced excess returns in the range of 18.87% to 31.05% for small caps. Those values shrink significantly when applied to large cap stocks, in the range of 3.51% to 9.11%.
- Over time: MLMs do not perform “against the test of time”, at all. Long/short value-weighted strategies, when based on monthly forecasts, produced excess returns from 14.14% to 11.91% over the entire sample period (1982-2020). Those annualized returns fall into the range of 7.26% to 11.91%, for the most recent 20-year period. When the tests were confined to the large cap universe, the excess returns dropped further into a range of -3.66% to -0.36%. A disappointing, result, as the large cap universe is of significant practical value for retail investors and many institutions. Effectively, MLMs offer no economic advantage on a risk-adjusted basis than the factor strategies that are popular today. That failure is especially apparent over the recent 20-year period.
Why does it matter?
It appears from this research that MLMs are unable to overcome the perceived weaknesses associated with traditional factor strategies and factor research. This paper adds to the current literature on predicting equity returns by analyzing the combined effects of time, forecast horizon, and firm size on MLM performance. The positive performance of MLMs is tied to small firms and short-term signals. “Consequently, this severely impedes their performance. In this regard, machine learning and popular factor strategies do not differ much.”
Readers should be aware that the dataset included 153 stock characteristics constructed consistent with the Jensen et al.(2022b) study. This insures the most salient of the anomalies in the cross-sectional asset pricing literature are used. The original code from the Jensen work was also used to insure the methodology and implementation were uniform. Studies that have merged the MLM and asset-pricing research have adopted the Jensen approach for similar reasons.
The most important chart from the paper
The results are hypothetical results and are NOT an indicator of future results and do NOT represent returns that any investor actually attained. Indexes are unmanaged and do not reflect management or trading fees, and one cannot invest directly in an index.
Abstract
Researchers and practitioners hope that machine learning strategies will deliver better performance than traditional methods. But do they? This study documents that stock return predictability with machine learning depends critically on three dimensions: forecast horizon, firm size, and time. It works well for short-term returns, small firms, and early historical data; however, it disappoints in opposite cases. Consequently, annual return forecasts have failed to produce substantial economic gains within most of the U.S. market in the last two decades. These findings challenge the practical utility of predicting returns with machine learning models.
About the Author: Tommi Johnsen, PhD
—
Important Disclosures
For informational and educational purposes only and should not be construed as specific investment, accounting, legal, or tax advice. Certain information is deemed to be reliable, but its accuracy and completeness cannot be guaranteed. Third party information may become outdated or otherwise superseded without notice. Neither the Securities and Exchange Commission (SEC) nor any other federal or state agency has approved, determined the accuracy, or confirmed the adequacy of this article.
The views and opinions expressed herein are those of the author and do not necessarily reflect the views of Alpha Architect, its affiliates or its employees. Our full disclosures are available here. Definitions of common statistics used in our analysis are available here (towards the bottom).
Join thousands of other readers and subscribe to our blog.