Wild-swinging oil prices have caused some chaos, or “volatility,” in the financial markets recently. We’ve also heard a lot in the financial media regarding the strong performance of “low volatility” funds.
But what exactly is “volatility” and how do we measure it?
We’ve posted some thoughts on the low volatility anomaly (e.g. Avoid High Beta Stocks. Period.)
But the use of volatility is somewhat ambiguous.
In the studies we’ve conducted we’ve referenced “beta” and Idiosyncratic volatility (“ivol”).
We thought it might make sense to take a quick break and describe how these concepts are calculated. We first describe 3 ways in which we can describe “volatility” and then we provide a spreadsheet so you can see these calculations in action.
Standard Deviation:
When we talk about a security’s volatility, we first think of the “standard deviation” of stock returns, which measures the degree of fluctuations in relation to its mean return over a period of time. This measure is calculated independently of the market and only requires data on the stock.
BETA:
While Standard Deviation measures the disparity of a security’s return over a period of time, “BETA”, another widely used metric, measures the co-movement of this security with the market. BETA can be calculated by regressing daily stock returns on a market benchmark (such as value weighted CRSP) over a period of time.
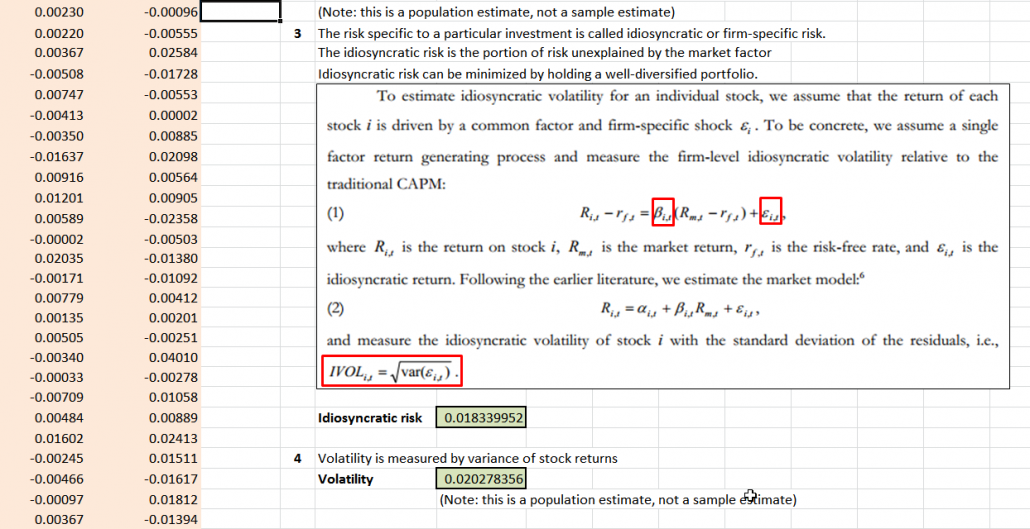
Idiosyncratic volatility (IVOL):
Business school professors tell us that there are 2 types of risk: systematic risk and unsystematic risk. Systematic risk can be estimated by Beta. The idiosyncratic risk is the portion of risk that unexplained by BETA. We calculate Idiosyncratic volatility (IVOL) as the standard deviation of the residuals from a regression that uses Beta to estimate the relationship between a given asset and the market.
Calculation Example:
- We use Amazon (Ticker: AMZN) stock as a single stock example, and use the value weighted CRSP index as the market benchmark. If forming a portfolio on 1/31/13, we would use daily returns from 1/31/12-1/31/13 to calculate beta and IVOL. (We use daily data to improve frequency and accuracy.)
- Data resource: Fama French Library, Yahoo Finance.
- BETA calculation follows the basic methodology in Betting Against Beta.
- IVOL calculation follows the basic methodology in IVOL and the Cross-Section of Expected Returns.
If you are interested, please click below to download the excel sheet.
———————————–
———————————–
About the Author: Wesley Gray, PhD
—
Important Disclosures
For informational and educational purposes only and should not be construed as specific investment, accounting, legal, or tax advice. Certain information is deemed to be reliable, but its accuracy and completeness cannot be guaranteed. Third party information may become outdated or otherwise superseded without notice. Neither the Securities and Exchange Commission (SEC) nor any other federal or state agency has approved, determined the accuracy, or confirmed the adequacy of this article.
The views and opinions expressed herein are those of the author and do not necessarily reflect the views of Alpha Architect, its affiliates or its employees. Our full disclosures are available here. Definitions of common statistics used in our analysis are available here (towards the bottom).
Join thousands of other readers and subscribe to our blog.