Executive Summary
Although it has been very difficult to overcome our initial skepticism, we’ve finally accepted the notion that simple technical analysis may serve as an effective way to manage risk and to time markets. As John Adams said many years ago, “Facts are stubborn things.” However, our stance on the hypothesis that “market valuations can be an effective tactical asset allocation mechanism” is still a long way from full acceptance–some tests suggest it works; others suggest it doesn’t. These tests are also fragile and often lack robustness: For example, in a piece we highlighted a few weeks ago, we found that identifying whether or not the market is “overvalued” can be highly dependent on framing.
But what is, “Tactical asset allocation with market valuations?”
Simply put, a tactical asset allocation model that incorporates market valuations typically suggests that we sell when prices are high relative to some historical benchmark, and we buy when prices are cheap relative to some historical benchmark. Buy low, sell high–an intuitive concept. We also know that over long horizons valuations are directly related to realized returns, however, just because we know valuations relate to long-term returns doesn’t necessarily imply we can beat a buy-and-hold strategy by timing the market based on valuations. So how should we proceed?
As evidence-based decision-makers we decided to test the various stories told in the market when it comes to tactical timing using valuations:
- We’ve already tested the “extreme valuation” hypothesis–sell when the market hits 90-percentile+ valuation–doesn’t work.
- Here we test the “relative valuation” hypothesis–sell when market is above average valuation; buy when below average–doesn’t seem to work.
- Gestaltu tests “absolute value” hypothesis–buy when valuation yield minus realized inflation is high; sell when it is low–this seems to work, but we need to do our own testing.
Bottom line: We are still on the fence when it comes to tactical asset allocation using valuations.
Tactical Asset Allocation and Intuition
Often, “intuitive” concepts don’t actually work in practice. In our experience, the more intuitive the concept, and the “easier” it is to implement, the less likely it is that it actually works. A few common examples (at least recently) come to mind:
- Buying high quality dividend stocks
- Avoiding treasury bonds
- Avoiding European stock markets
- Buying hedged currency products
Who knows how any of these trades will end up, but for many investors they are both intuitive and easy to digest, which is to us a potential sign these “obvious” trades probably won’t end up being that great on a relative basis.
Another intuitive trade is to tactically allocate a portfolio’s market exposure based on valuation metrics (e.g., P/E, P/B, CAPE, etc.). As hard-core value-investors, with a strong belief in applying value-investing concepts to stock selection, we would love nothing more than to identify a way to apply valuation to market timing! Talk about easy to digest. Yet it’s a tough row to hoe — market timing has traditionally been considered to be a fool’s errand. Although we have been taught that attempts at market timing usually end badly in the long run, there is evidence that some approaches have merit.
Consider simple technical analysis: I thought technical analysis was a combination of voodoo and blasphemy before finally accepting the notion that trend-following rules are one potential way to avoid large drawdowns and maintain reasonable returns in the market.
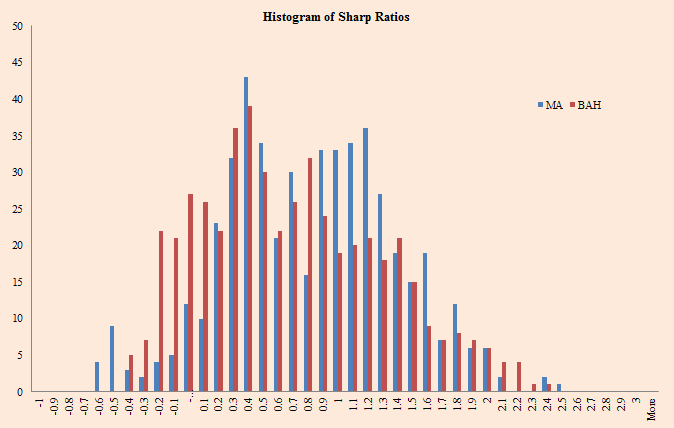
Here is a chart from a simulation study we did a while ago on the subject of simple technical analysis in the form of moving-average rules:
![]()
Sharpe ratios certainly seem interesting relative to a buy-and-hold investor.
But my acceptance of trend-following rules took over 4 years!
My acceptance of a timing rule that was based on valuations would take a lot less evidence, because I suffer from confirmation bias and I’d love to see something actually work in practice. But it hasn’t happened…at least not yet…
Where we sit on Valuation as a Timing Tool
The “99% percentile,” or the broader timing rule that suggests we dump stocks when they are at a historical high, doesn’t seem to work.
A more detailed study on dumping stocks at extreme valuations dug a little deeper. We looked at the following measures and compared/contrasted them with trend-following:
- 1/CAPE = Inverse of Shiller’s Cyclically Adjusted PE ratio.
- Dividend Yield = Total Dividends for SP500 over the past 12 months divided by the SP500 closing price.
- Default Yield Spread = BAA Yield – AAA Yield.
- GNP/Marketcap = GNP of U.S. divided by the total market capitalization of U.S. Equity Markets.
Again, no dice.
Finally, we are investigating an interesting post by Adam and his team at Gestaltu.com. Prelims look promising, but there are potential robustness issues. More to come…
And finally, our friend Meb Faber posted a tweet recently:
People often say you can’t use CAPE (or value) to time the market. That isn’t true. Simple example: Long when CAPE < average rolling CAPE. Otherwise bonds. Pair that with simple trend system and you have a beauty value/trend system.
We certainly agree that adding a simple trend system will add serious risk-management mojo to most historical return streams. But this post isn’t focused on trend-following or the blended valuation/trend model suggested by Meb.
Let’s focus at the valuation component of the concept.
Testing the simple CAPE < Avg (CAPE) Rule
Let’s run a quick test on this simple valuation-timing rule.
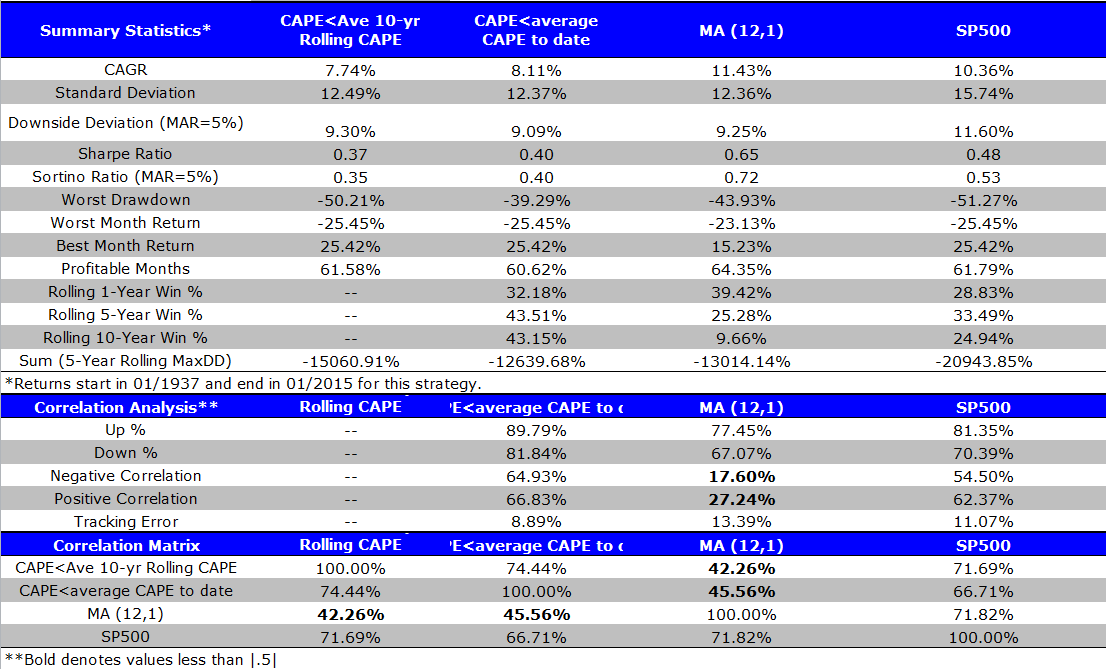
- Strategy: Long the S&P 500 when last month’s CAPE < Average Rolling 10-year CAPE (when market is relatively cheap); Otherwise, long the 10-yr bonds (when the market is relatively expensive).
- We also test CAPE < Average CAPE using an expanding window (using cumulative-to-date data)
- Data Period: 1/1937-1/2015 (For the rolling analysis we burn 10 years of data, so our analysis starts in 1937, not 1927).
Summary Statistics:
The simple CAPE < Avg 10-year Rolling CAPE strategy (rolling window) and CAPE < Ave CAPE to date (expanding window) lowers volatility a bit. But in terms of CAGR and Sharpe ratio, it is worse than B&H. By comparison, the 12-month simple moving average strategy performs much better. We also examine different rolling lookback periods: 1-year, 3-year, and 5-year…
None of them beats B&H; all lose to simple trend-following.
The results are hypothetical results and are NOT an indicator of future results and do NOT represent returns that any investor actually attained. Indexes are unmanaged, do not reflect management or trading fees, and one cannot invest directly in an index. Additional information regarding the construction of these results is available upon request.
Maybe CAPE is busted? How about other metrics?
Here we test the market-timing performances of 5 other value metrics that we have examined in prior research. In prior research we focus on value investing metrics to identify cross-sectional predictions (i.e., stock selection ability), which seems to work, however, we need to remember that our focus now is on time-series prediction (i.e., timing market exposures over time).
The value investing metrics are as follows:
- Earnings to Market Capitalization (E/M).
- Book Value of Equity to Market Capitalization (B/M)
- EBITDA to Total Enterprise Value (EBITDA/TEV).
- Free Cash Flow to Total Enterprise Value (FCF/TEV).
- Gross-Profits to Total Enterprise Value (GP/TEV).
Note, that all these metrics are in “yield” format, so higher is cheaper and lower is more expensive. This is in contrast to the CAPE ratio where higher is more expensive and cheaper is less expensive. A little mental gymnastics, but that is healthy for our brains :-)
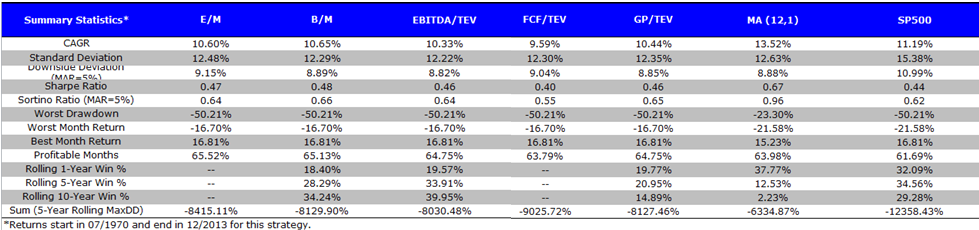
Rolling-Window Performance:
The rolling technique looks back over a fixed time period (e.g., 10 years) to calculate an “average” value that will serve as the anchor for our valuation-based trading signal.
- Strategy: Long the S&P 500 when last month’s value metric > Average Rolling 10-year value metric (when market is relatively cheap); Otherwise, long 10-yr bonds (when market is relatively expensive).
- Data Period: 7/1970 to 12/2013 (we burn 10 years of data, so our analysis starts in 1960).
All of the valuation-based timers are roughly equivalent to B&H, and all of these systems substantially underperform simple trend-following rules. (Click chart to enlarge).
Click to enlarge The results are hypothetical results and are NOT an indicator of future results and do NOT represent returns that any investor actually attained. Indexes are unmanaged, do not reflect management or trading fees, and one cannot invest directly in an index. Additional information regarding the construction of these results is available upon request.
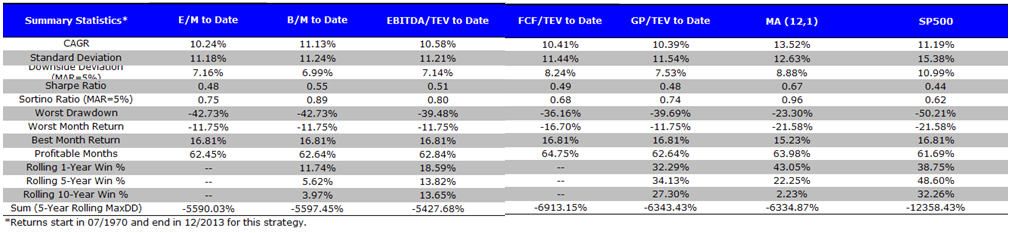
Expanding Window Performance:
Here we investigate a different lookback technique: the expanding-window method. In contrast to the rolling lookback, a expanding lookback method uses a ever growing lookback period that contains the entire history available in the past. So if we are standing in 1940 and our data starts on 1930, we use 10 years of data to determine our “average.” However, if we are standing in 1960 and our data starts on 1930, we would use 30 years of data to determine our “average.”
- Strategy: Long the S&P 500 when last month’s value metric > Average value metric to date (when market is relatively cheap); Otherwise, long 10-yr bonds (when market is relatively expensive).
- Data Period: 7/1970 to 12/2013
All of the valuation-based timers are roughly equivalent to B&H, and all of these systems substantially underperform simple trend-following rules. (Click chart to enlarge).
Click to enlarge The results are hypothetical results and are NOT an indicator of future results and do NOT represent returns that any investor actually attained. Indexes are unmanaged, do not reflect management or trading fees, and one cannot invest directly in an index. Additional information regarding the construction of these results is available upon request.
Is there a Valuation-Timing Holy Grail?
Maybe it exists, but thus far, we haven’t found it.
We will continue to look, but as our search widens and our techniques get more and more complex, we must consider that we may be susceptible to optimization and data-mining.
Or perhaps valuation-timing simply isn’t effective on the S&P 500? That is possible.
But that doesn’t mean it may not work across countries or on other asset classes. We simply can’t identify a reliable methodology in the context of US stocks.
Where to from here?
Well, we are working on a promising technique we’ve reviewed from Gestaltu and our results will be shared with our community. Until then, if you have any valuation-based market-timing ideas that are simple, robust, and easy to replicate, please pass along. Also, refrain from sending us low-turnover, or low-frequency valuation timing evidence (e.g., show us that high P/E is associated with poor returns). These statistics, while interesting, provide little guidance when it pertains to managing a real-world portfolio.
About the Author: Wesley Gray, PhD
—
Important Disclosures
For informational and educational purposes only and should not be construed as specific investment, accounting, legal, or tax advice. Certain information is deemed to be reliable, but its accuracy and completeness cannot be guaranteed. Third party information may become outdated or otherwise superseded without notice. Neither the Securities and Exchange Commission (SEC) nor any other federal or state agency has approved, determined the accuracy, or confirmed the adequacy of this article.
The views and opinions expressed herein are those of the author and do not necessarily reflect the views of Alpha Architect, its affiliates or its employees. Our full disclosures are available here. Definitions of common statistics used in our analysis are available here (towards the bottom).
Join thousands of other readers and subscribe to our blog.