Forbes outlines one of Ben Graham’s basic value investment strategies and analyzes how it has performed from 1949 through 2012.
Even with all of the fiscal cliff and European debt drama in 2012, the Graham-based portfolio has had a particularly good year. While the S&P 500 has notched a solid 13.7% gain (all performance figures through Dec. 17), the Graham portfolio is up more than twice that, gaining 28.5%.
It’s been a few years since this study was performed and we’ve been in a raging bull market. We were curious to see how the deep value strategy performed and what stocks fit the screen.
We deploy the following value screens posed by Graham:
- Current Ratio > 2.0
- EPS growth over last 5 years > 30%
- No negative EPS over last 5 years
- P/E < 15
- P/Average EPS last 3 years < 15
- max(P/E, P/Average EPS) * P/B < 22
- Market Cap cut is 10th percentile( around 330M as of 2015/03)
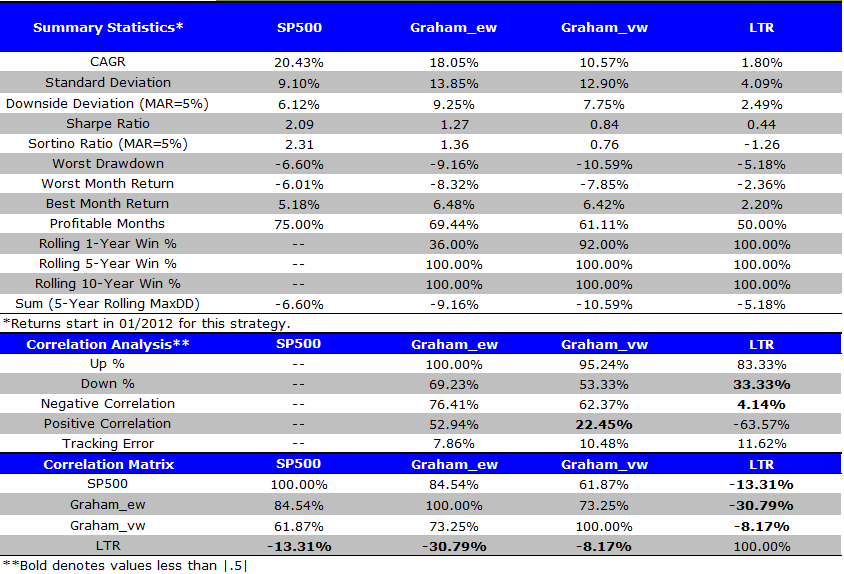
Results are gross of management fee and transaction costs for illustrative purposes only. These are simulated performance results and do not reflect the returns an investor would actually achieve. All returns are total returns and include the reinvestment of distributions (e.g., dividends).
- SP500 = SP500 Total Return Index
- Graham_ew = Ben Graham value strategy, equal-weighted
- Graham_vw = Ben Graham value strategy, value-weighted
- LTR = Merrill Lynch 7-10 year Government Bond Index (prior to 6/1982, Amit Goyal Data)
Summary Value Investing Performance 2012/01 to 2014/12
The results are hypothetical results and are NOT an indicator of future results and do NOT represent returns that any investor actually attained. Indexes are unmanaged, do not reflect management or trading fees, and one cannot invest directly in an index. Additional information regarding the construction of these results is available upon request.

The results are hypothetical results and are NOT an indicator of future results and do NOT represent returns that any investor actually attained. Indexes are unmanaged, do not reflect management or trading fees, and one cannot invest directly in an index. Additional information regarding the construction of these results is available upon request.
2012 and 2013 were great; 2014 was painful. Overall, since the value strategy underperformed by over 2% and the strategy is “busted,” value-investing no longer works, and Graham’s ideas are outdated. This general pattern of returns is similar to live performance on many value strategies over this time period.
What Names Pass the Value Investing Screen Now? (as of 4/27/2015)
There was only 1 name that fits the criteria outlined above:
HGR US EQUITY, Hanger Inc:
- Current Ratio 3.94
- EPS growth over 5 years: 59%
- No negative EPS over last 5 years
- P/E: 14.38
- P/3 years average EPS: 13.24
- PB adjust ratio: 20.71
- Market Cap: $846MM
Note, this is NOT a stock recommendation. We are simply highlighting the output of the screen proposed by the Ben Graham system in real-time.
Thoughts?
About the Author: Wesley Gray, PhD
—
Important Disclosures
For informational and educational purposes only and should not be construed as specific investment, accounting, legal, or tax advice. Certain information is deemed to be reliable, but its accuracy and completeness cannot be guaranteed. Third party information may become outdated or otherwise superseded without notice. Neither the Securities and Exchange Commission (SEC) nor any other federal or state agency has approved, determined the accuracy, or confirmed the adequacy of this article.
The views and opinions expressed herein are those of the author and do not necessarily reflect the views of Alpha Architect, its affiliates or its employees. Our full disclosures are available here. Definitions of common statistics used in our analysis are available here (towards the bottom).
Join thousands of other readers and subscribe to our blog.