Were in the middle of an academic research project and we ran a simple long-term trend-following model from January 1, 1801 to September 30, 2015.
Recently, there has been some research on the performance of trend-following rules over long periods here (and highlighted by CXO here).
Our trend-following methodology is further described in our downside protection piece.
- Absolute Performance Rule: Time Series Momentum Rule (TMOM)
- Excess return = total return over past 12 months less return of T-Bills
- If Excess return >0, go long risky assets. Otherwise, go long alternative assets (T-Bills)
- Concept made popular by Gary Antonacci
- Trending Performance Rule: Simple Moving Average Rule (MA)
- Moving Average (12) = average of 12 month prices
- If Current Price – Moving Average (12) > 0, go long risky assets. Otherwise, go long alternative assets (T-Bills).
- Concept made popular by Meb Faber
- Robust Asset Allocation Rule: Combination of TMOM and MA (ROBUST)
- 50% TMOM, 50% MA
Our study includes 6 asset classes and strategies assessed over the sample time period:
- SPX = S&P 500 Total Return Index spliced with generic US stock market data in early years
- LTR= 10-Year Treasury Total Return Index
- SP_MA = SPX with MA rule applied
- 60,40=60/40 SPX, LTR
- SP_TMOM= SPX with TMOM rule applied
- SP_ROBUST= SPX with ROBUST rule applied
Results are gross, no fees are included. All returns are total returns and include the reinvestment of distributions (e.g., dividends). Indexes are unmanaged, do not reflect management or trading fees, and one cannot invest directly in an index.
Key Trend-Following Results
First, the laundry list of domestic equity drawdowns over time that exceed 15%. I’ve highlighted the worst performer in red across the index, 10-years, and the index with MA:
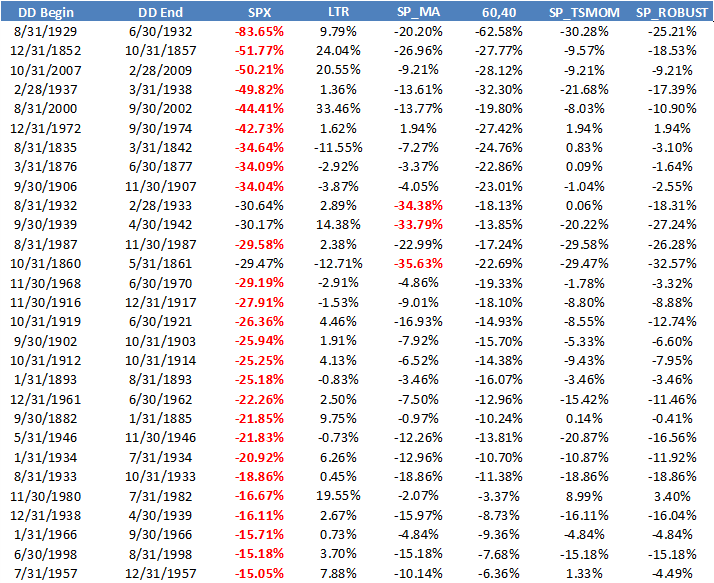
The results are hypothetical results and are NOT an indicator of future results and do NOT represent returns that any investor actually attained. Indexes are unmanaged, do not reflect management or trading fees, and one cannot invest directly in an index. Additional information regarding the construction of these results is available upon request.
Takeaways
- MA rule, TMOM rule and ROBUST rule, historically, have reduced drawdowns
- Treasury bonds, historically, act like insurance assets and serve as a “crisis alpha” instrument
Robustness
Here we look at top SPX drawdowns and the associated results across the different strategies over two sample periods:
Downside Protection: 1800-1926
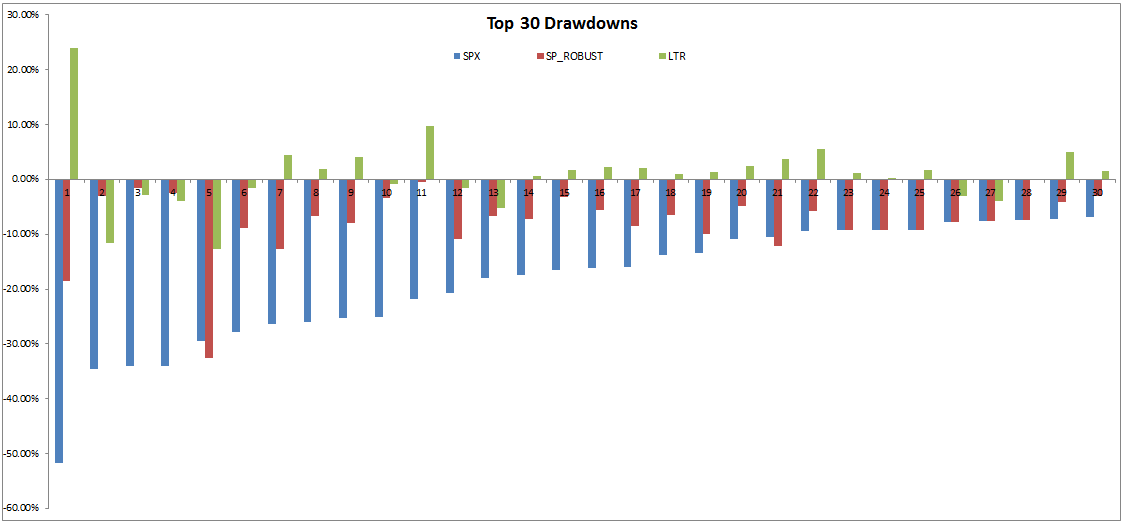
The results are hypothetical results and are NOT an indicator of future results and do NOT represent returns that any investor actually attained. Indexes are unmanaged, do not reflect management or trading fees, and one cannot invest directly in an index. Additional information regarding the construction of these results is available upon request.
Downside Protection: 1927-2015
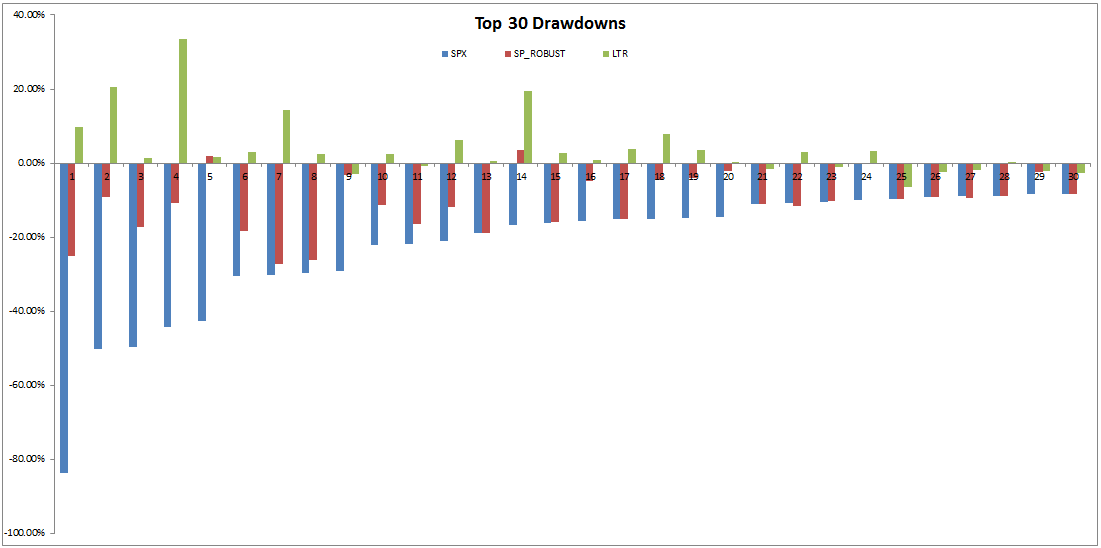
The results are hypothetical results and are NOT an indicator of future results and do NOT represent returns that any investor actually attained. Indexes are unmanaged, do not reflect management or trading fees, and one cannot invest directly in an index. Additional information regarding the construction of these results is available upon request.
Bottom line: asset allocation and tactial market timing are interesting subjects if one seeks to minimize tail risks.

About the Author: Wesley Gray, PhD
—
Important Disclosures
For informational and educational purposes only and should not be construed as specific investment, accounting, legal, or tax advice. Certain information is deemed to be reliable, but its accuracy and completeness cannot be guaranteed. Third party information may become outdated or otherwise superseded without notice. Neither the Securities and Exchange Commission (SEC) nor any other federal or state agency has approved, determined the accuracy, or confirmed the adequacy of this article.
The views and opinions expressed herein are those of the author and do not necessarily reflect the views of Alpha Architect, its affiliates or its employees. Our full disclosures are available here. Definitions of common statistics used in our analysis are available here (towards the bottom).
Join thousands of other readers and subscribe to our blog.