Anomalies and News
- Engelberg, McLean and Pontiff
- A version of the paper can be found here.
- Want a summary of academic papers with alpha? Check out our Academic Research Recap Category.
Abstract:
Using a sample of 97 stock return anomalies documented in published studies, we find that anomaly returns are 7 times higher on earnings announcement days and 2 times higher on corporate news days. The effects are similar on both the long and short sides, and they survive adjustments for risk exposure and data mining. We also find that anomaly signals predict analyst forecast errors of earnings announcements. Taken together, our results support the view that anomaly returns are the result of mispricing, which is at least partially corrected upon news arrival.
Alpha Highlight:
Over 300+ “anomalies” have been identified in the academic literature over the past few decades, although not all of them hold up under robustness checks. The source of these “anomalies” emerged as another major debate in the context of other strains of research. We have our own favorites in the form of value and momentum, but there are many others.
Three popular explanations for stock anomalies are:
- Risk-based Explanations: Fama and French (1992, 1996) argue that the value premium represents compensation for additional risks born. But this explanation is hard to reconcile with many new anomalies. For example, momentum has become the “main embarrassment” of the three-factor model. That said, our own research suggests that risk certainly plays at least a partial role in anomalies.
- Behavioral-based Explanations: Return-predictability reflects mispricing caused by human bias and because of market frictions, anomalies persist. This take is explained in our sustainable active investing framework.
- Data mining: Correlation does not always equal causality; consider survivor bias and/or data selection bias.
This paper reviews the 97 different variables studied in McLean and Pontiff (2015) and compares the average anomaly returns associated with on versus off days with firm-specific news. The authors hypothesize that if anomaly returns are due to expectation errors, anomaly portfolios should perform better on days when new information is released, since new information lead investors to update their expectations.
The paper’s core results argue for the behavioral explanation and suggests that anomalies are at least partially driven by behavioral bias, which leads to systematic expectation errors.
Main Findings:
This paper investigate the performances of 97 anomalies from 1979 to 2013. Again, it compares the average anomaly returns on news versus non-news days.
Here are the main findings:
- Anomaly returns are 7 times higher on earnings announcement days and 2 times higher on corporate news days!
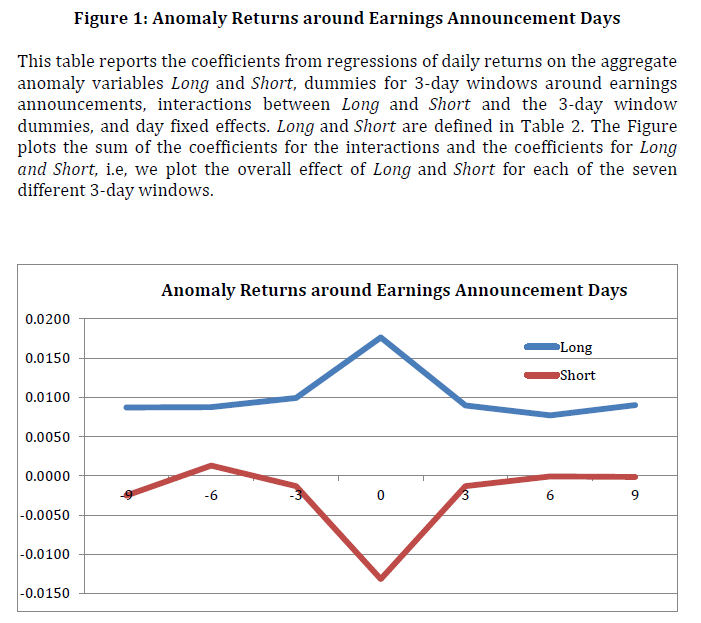
- When it comes to the long and short side of anomaly portfolios, anomaly returns are 5.5 times higher on earnings day for long-side stocks and 10 times lower for short-side stocks. (See figure 1)
- This finding is robust across many anomalies.

The results are hypothetical results and are NOT an indicator of future results and do NOT represent returns that any investor actually attained. Indexes are unmanaged, do not reflect management or trading fees, and one cannot invest directly in an index. Additional information regarding the construction of these results is available upon request.
We’ll leave the final word to the authors:
Our results suggest that investors are surprised by news. When new information is released investors revise their biased beliefs, which in turn, causes prices to change, which in turn, causes the observed return predictability.
More Research Recaps about “Anomalies and News”:
- Stock Prices and Earnings: A History of Research (Dechow, Sloan and Zha, 2013)
- Being Surprised by the Unsurprising: Earnings Seasonality and Stock Returns. (Chang, Hartzmark, Soloman and Soltes, 2015)
- Investor Inattention and Friday Earnings Announcements (Dellavigna and Pollet, 2009)
- When Two Anomalies Meet: The Post-Earnings Announcement Drift and the Value – Glamour Anomaly (Yan and Zhao, 2011)
- Recency Bias and Post-Earnings Announcement Drift (Ma, Whidbee and Zhang, 2014)
About the Author: Wesley Gray, PhD
—
Important Disclosures
For informational and educational purposes only and should not be construed as specific investment, accounting, legal, or tax advice. Certain information is deemed to be reliable, but its accuracy and completeness cannot be guaranteed. Third party information may become outdated or otherwise superseded without notice. Neither the Securities and Exchange Commission (SEC) nor any other federal or state agency has approved, determined the accuracy, or confirmed the adequacy of this article.
The views and opinions expressed herein are those of the author and do not necessarily reflect the views of Alpha Architect, its affiliates or its employees. Our full disclosures are available here. Definitions of common statistics used in our analysis are available here (towards the bottom).
Join thousands of other readers and subscribe to our blog.

