Shakespeare warned of the following:(1)
“Neither a borrower nor a lender be when purchasing 1042 QRP”
Okay, so we took some liberties with the Bard’s verse. However, our paraphrased warning is well suited to business owners seeking to sell their businesses to an ESOP through an IRS section 1042 election (or to their fiduciary advisors). A borrower and a lender is exactly what such sellers become when they purchase floating rate notes (“FRN”) to monetize their 1042 election sale proceeds. At Alpha Architect, we believe business sellers under 1042 elections have better and more affordable tax-deferred roll-over options.(2) Sellers who bear in mind the FACTS(3) might conclude that direct investment in a diversified portfolio of large cap, blue chip equities will capture greater after-tax value from their 1042 qualified replacement property (“QRP”) portfolios.
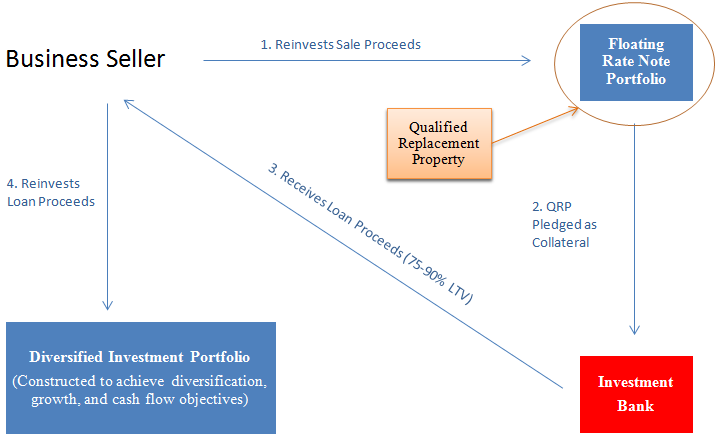
In our detailed market survey of 1042 QRP investment strategies, which you can read here, we described and ranked the range of options available to business owners who elect to sell their shares through a 1042 tax deferred sale. The most prevalent of those strategies is a complicated and expensive floating rate note approach, designed to preserve the seller’s capital gains tax deferral while freeing a significant portion of the sale proceeds for reinvestment. We likened it to a structured product, in which the usual payment features of a traditional security, such as a conventional investment-grade bond, are replaced with non-traditional payoffs derived not from the corporate issuer’s own cash flow but rather from the performance of one or more different assets.(4) In the case of a floating rate note monetization strategy, the purchaser trades away the coupon payments of the FRN for the ability to invest in a separate portfolio of assets purchased with loan proceeds from the hypothecated QRP. The seller bears a negative carry charge for the pleasure of accessing his ESOP sale proceeds, because the interest rate paid on the loan exceeds the FRN’s coupon payment. The graphic depiction below highlights this strategy’s flow of funds.
As we described in our market survey, there are arguably more affordable alternatives to floating rate notes that can achieve investor goals more efficiently. One alternative approach is to invest the sale proceeds directly in qualified replacement property consisting of a diversified portfolio of carefully selected large-cap, blue-chip equities, designed to replicate a passive equity index fund. There are many reasons why an investor would select such an asset for a long investment horizon, such as for 1042 QRP. Between 1927 and 2016, the stocks of the S&P 500 had a total annual average return of 9.93%, gross of any fees and transaction costs. Warren Buffet’s views on the attractiveness of such an investment asset reaffirm our own beliefs. For the non-charitable assets of his estate, Buffet has left very straightforward and powerful instructions:
“My advice to the trustee could not be more simple: Put 10% of the cash in short-term government bonds and 90% in a very low-cost S&P 500 index fund.”(5)
The IRS rules defining 1042 QRP are complicated, so investors need a rigorous approach to screening and documenting their due diligence for such a portfolio. Nevertheless, such a solution is not impossible.
Comparison of 1042 QRP Strategy Costs and Outcomes
A simple comparison exercise will highlight the differences in expected costs and investment outcomes for investors in both of the above 1042 QRP roll-over strategies. Below we compare the hypothetical cases of two selling shareholders pursuing share sales to ESOPs through 1042 elections.
Assumptions common to both sellers are as follows:
- Net cash sale proceeds received from the ESOP trust for shares = $10,000,000;
- Seller Objective 1: Seek permanent deferral of capital gains taxes by passing 1042 QRP wealth to heirs through estate;
- Seller Objective 2: Generate annual pre-tax income of $200,000, adjusted upward annually for assumed 2.5% inflation rate;
- Seller Objective 3: Achieve equity-like returns on invested wealth in order to capitalize on 30-year assumed investment horizon.
Scenario 1 – Floating Rate Notes as 1042 QRP
In our first case, assume the seller rolls his sale proceeds into 1042 QRP consisting of a floating rate note, which he has purchased from his broker as Step 1. We assume that the business seller must pay a 1% dealer mark-up(6) to obtain and purchase the note (new FRN issuance has dried up in the rising rate environment), and that the floating rate note pays a variable coupon of 0.69%.(7) We base this coupon estimate on the pricing terms from a sample of five floating rate note issues, each indicating reference rates of 3-month LIBOR and spreads of minus 30 bps to minus 35 bps. The following table sets forth the impact of these terms on the seller’s funds:
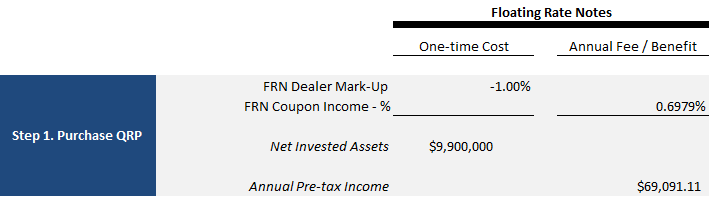
So far, so good. The seller has purchased 1042 qualified replacement property consisting of $9.9 million worth of a floating rate note, issued by a US operating company and paying an annual interest coupon of approximately $69,000 per year, at current rates. The transaction’s cost was $100,000, reflecting dealer mark-up and commission, which we have disaggregated from the published rate for sake of illuminating these hypothetical fees.
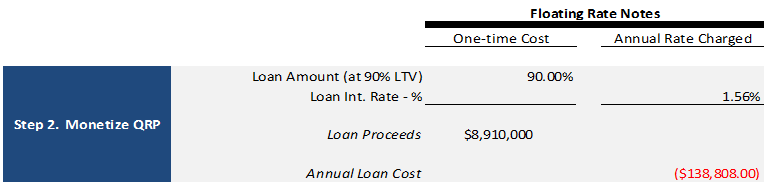
In Step 2 of this monetization strategy, Seller 1 then pledges the QRP notes as collateral to his broker, who extends the seller a cash loan for 90%(8) of the notes’ face value. There now remains $8,910,000 available to invest from the seller’s original $10 million of proceeds, due to the over-collateralization required by the lending broker. The seller must also pay annual interest on the loan in the area of LIBOR plus 50 bps (about 1.5%, currently), a rate that is consistent with 70-80 bps of negative annual carry on the entire transaction amount. In our hypothetical example, this negative carry results in $69,717 of annual net interest expense borne by the seller, after accounting for the offsetting interest received from the floating rate note coupon payments.
We caveat our example to note that the above assumptions are aggressive and reflect the favorable prevailing credit environment at the time of publishing. Loan-to-value ratios have generally ranged between 75% and 90% during the past decade, reflecting recession and credit market challenges. Were the general economy, or indeed the specific creditworthiness of the FRN issuer itself, to deteriorate, it is likely that this strategy would generate less loan proceeds than our assumed 90% of QRP value. How likely is the LTV ratio to deviate below 90%? Consider whether the next 40 years hold any less potential for economic and geopolitical upheaval than the past few decades witnessed.
In Step 3, the seller then reinvests his remaining sale/loan proceeds, which he monetized through his QRP, in the asset of his choosing. For the sake of simplicity in this illustration, we assume that both sellers capitalize on their long-term investment horizons by purchasing a low-cost portfolio of large cap US equities, such as represented by the S&P 500.
The following table summarizes the investment costs and results obtained by the first seller, through the FRN monetization strategy. It reflects the annual withdrawal of income, consistent with both sellers’ objectives, set forth above, and our assumption that both sellers earn an annual total pretax return of 9.93% on their portfolios:
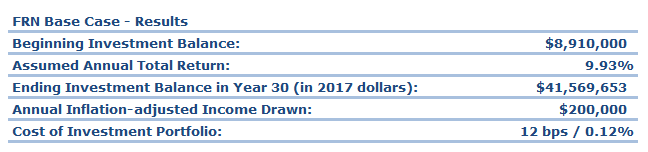
Assumed annual total return of investment assets of 9.93% is gross of fees and transaction costs. The assumed cost of the large cap equities investment portfolio of 12 bps reflects the avg. expense ratio in 2015 of passive US Equities investment funds.(9) The results are hypothetical results and are NOT an indicator of future results and do NOT represent returns that any investor actually attained. Indexes are unmanaged, do not reflect management or trading fees, and one cannot invest directly in an index.
Scenario 2 – Passive Blue-chip Equities as 1042 QRP
Now let’s examine the outcome of the second seller, in scenario 2, who invests sale proceeds directly in qualified replacement property consisting of a diversified portfolio of carefully selected large-cap, blue-chip equities, designed to replicate a passive equity index fund. This is a considerably simpler strategy, a key virtue of which is the elimination of the costly hypothecation of intermediate securities (i.e., the floating rate notes). Equities are perpetual securities and, if carefully selected, are ideally suited to the role of qualified replacement property. In this regard, a well-diversified(10) portfolio of blue-chip equities should achieve the capital gains tax deferral goals of most sellers.
Large-cap US equities can be purchased very efficiently and transparently. The second Seller can likely invest the entire amount of sale proceeds in equities with minimal transaction costs, which we assume to be stock commissions of 1 bp (0.01%) in this exercise. Further, with adequate diversification, this portfolio retains substantially the same dividend yield as the S&P 500, which is 2.09% at the time of publishing. This yield contrasts starkly with the assumed -0.70 bps negative carry associated with the floating rate note strategy, above. The following table sets forth the impact of these terms on the second seller’s funds:
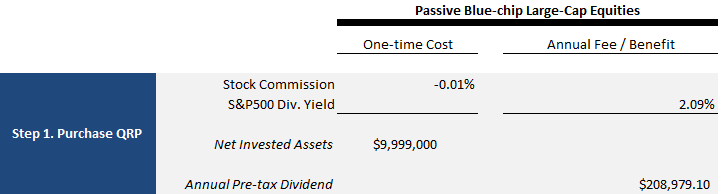
To summarize, seller 2 has purchased 1042 qualified replacement property consisting of approximately $10.0 million worth of blue-chip equities, issued by US operating companies and paying annual dividends of approximately $209,000 per year, at current dividend yields.
Fortunately for the second seller, there is no Step 2! The QRP assets in the portfolio are assumed to be held until the demise of the seller, at which point they pass through the seller’s estate to heirs at a stepped up basis, free of capital gains tax.
The following table summarizes the investment results obtained by the second seller, through a direct investment in QRP consisting of passive blue-chip equities:
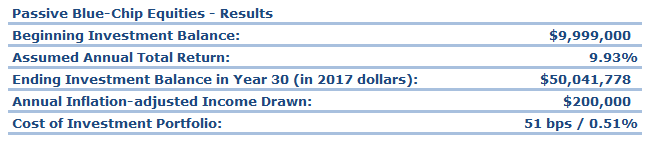
Assumed annual total return of investment assets of 9.93% is gross of fees and transaction costs. The cost of the large cap equities investment portfolio reflects 1 bp commissions and 50 bps investment management advice fee. The results are hypothetical results and are NOT an indicator of future results and do NOT represent returns that any investor actually attained. Indexes are unmanaged, do not reflect management or trading fees, and one cannot invest directly in an index.
Conclusions: 1042 QRP Results Comparison
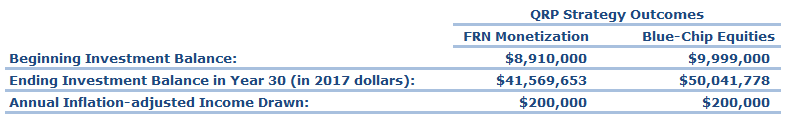
With simple yet reasonable base assumptions, we have compared the logistics, costs and investment outcomes of two hypothetical selling shareholders who pursue alternative QRP roll-over strategies in pursuit of their parallel objectives. Both sellers start out with $10,000,000 of cash sale proceeds; both seek to defer capital gains recognition permanently, through their respective estates; both seek modest income generation while achieving equity-like returns on the bulk of their invested wealth in order to capitalize on the assumed 30-year investment horizon. For the sake of simplicity, the asset of ultimate choice for both sellers is assumed to be a portfolio of large cap equities designed to replicate the returns of the S&P 500.
But here, the similarities end.
In Scenario 1, the first seller implements a complex and costly floating rate note monetization strategy en route to his ultimate intended investment in a low-cost index fund. That investment is assumed to achieve total returns of 9.93% per year, consistent with the average annual returns of the S&P 500 between 1927 and 2016. In scenario 2, the second seller implements a simple and affordable direct investment in a portfolio of QRP-compliant large-cap, blue-chip US equities, also designed to achieve the risk and return profile of the S&P 500. Their side-by-side investment outcomes, below, reflect the steep differences in the respective costs and levels of efficiency in meeting their objectives.
The results are hypothetical results and are NOT an indicator of future results and do NOT represent returns that any investor actually attained. Indexes are unmanaged, do not reflect management or trading fees, and one cannot invest directly in an index.
This is as good a comparison as it can get for the seller of Scenario 1, who purchased the floating rate note QRP. There are a number of areas where this strategy can under-perform our hypothetical base case—sometimes significantly. For example, one can imagine an economic environment in which seller 1 is only able to obtain a loan for 85% of the value of the floating rate note collateral (i.e., 85% LTV ratio), versus 90% assumed in our case. Or else assume the terms of the seller’s loan require that they hire the lending broker to oversee their equity investment assets, with attendant annual charges for advice fees—say, 50 bps per year. Or perhaps the floating rate note issuer exercises its call option—a common term among the FRN issues we reviewed—and redeems the notes before Seller 1 is deceased, requiring that capital gains be recognized and taxes paid. The following table sets forth the ending investment balances in each of these downside scenarios, all else equal:
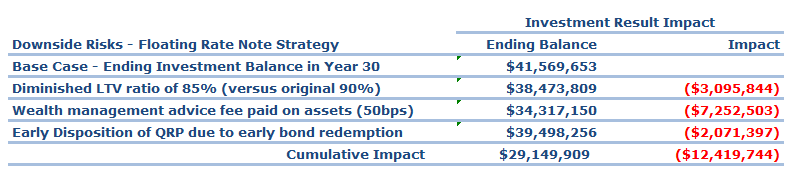
All financial impacts in 2017 dollars. Early bond redemption assumes zero tax basis in QRP, 30% blended federal and state capital gains tax rate and gains recognition during year 15. The results are hypothetical results and are NOT an indicator of future results and do NOT represent returns that any investor actually attained. Indexes are unmanaged, do not reflect management or trading fees, and one cannot invest directly in an index.
Each of the downside risks analyzed above is a possibility, and there is anecdotal evidence of their occurrence during the past 10 years among purchasers of floating rate notes. None of these risks is an issue for Seller 2, who invests directly in a passive portfolio of blue-chip US equities. Although Seller 2 can borrow against his QRP, it is not assumed that he does so in our example. The cost of Seller 2’s QRP portfolio—51 bps, reflected above—is assumed to cover the annual advice fee and transaction costs for the strategy’s implementation; since that advice covers the selection, screening and documentation of the individually purchased securities in the portfolio, an investor would not face an asset management fee like the kind seller 1 pays for his index fund. Finally, common equities are perpetual securities and consequently are not subject to call provisions.
In the side-by-side comparison of the two QRP rollover strategies that we have analyzed, the hypothetical direct equity investment of sale proceeds results in the accumulation of approximately $8.5 million more wealth over an assumed 30 year holding period than a similar investment implemented through a more costly and complex floating rate note monetization approach. When additional risks typically associated with conventional floating rate note strategies are considered, the potential under-performance can approach $21 million versus the direct equity investment. The impact of high costs and ongoing fee drag, as well as sub-optimal attributes specific to floating rate notes as an asset class, make being both a borrower and a lender a pretty bad idea.
So what is that foregone $8.5 – $21 million, paid by our hypothetical seller in scenario 1? From our perspective, it represents involuntary charity on the part of that seller toward the investment banks that issued and sold him those floating rate notes. Even if your charitable intent knows no bounds, surely there are nobler causes to support!
If you are interested in learning more about our 1042 QRP solutions, contact us (ask for Doug) and we will collaborate and build a win-win solution.

References[+]
| ↑1 | Polonius utters these immortal words in Hamlet to young Laertes as the latter sets off to make his way in the world: “Neither a borrower nor a lender be / for oft both the loan and the friendship are lost…” |
|---|---|
| ↑2 | This article was updated on February 6, 2019. |
| ↑3 | Our systematic FACTS framework (Fees, Access, Complexity, Taxes and Search) is helpful to clarify important considerations when comparing investment opportunities. You can learn more about it here. |
| ↑4 | Kitces has an interesting piece here on structured notes. |
| ↑5 | Note: 2013 Annual Report, Chairman’s Letter, Berkshire Hathaway, Inc., Pg. 20. |
| ↑6 | Our assumption in this analysis is that sellers are charged only a 1% dealer mark-up and no commissions, however anecdotal evidence suggests that sellers more often than not are paying all-in premiums that range between 1-3% of the note’s face value. This is because the investment banks that serve as dealers of floating rate notes control virtually all of their available inventory and seek to profit from their market positions. |
| ↑7 | Based on a recent 3-month LIBOR rate of 0.99789% and a spread of minus 30 bps. Source for LIBOR rates: http://www.global-rates.com/interest-rates/libor/american-dollar/usd-libor-interest-rate-3-months.aspx accessed on January 3, 2017. |
| ↑8 | This percentage is known as the loan-to-value ratio (“LTV”) and reflects the collateral cushion that lenders require. |
| ↑9 | Source: Morningstar and http://www.thinkadvisor.com/2016/04/26/investors-paid-lowest-fund-and-etf-fees-ever-in-20 accessed on December 31, 2016. |
| ↑10 | How much diversification is enough? Consider that a lot can happen in 30-40 years, particularly acquisitions by competitors and financial sponsors. We think 400 stocks (or more) is a minimum level, in a market cap-weighted portfolio, to preserve the portfolio’s earnings power and maintain asset diversification over the entire holding period. |
About the Author: Doug Pugliese
—
Important Disclosures
For informational and educational purposes only and should not be construed as specific investment, accounting, legal, or tax advice. Certain information is deemed to be reliable, but its accuracy and completeness cannot be guaranteed. Third party information may become outdated or otherwise superseded without notice. Neither the Securities and Exchange Commission (SEC) nor any other federal or state agency has approved, determined the accuracy, or confirmed the adequacy of this article.
The views and opinions expressed herein are those of the author and do not necessarily reflect the views of Alpha Architect, its affiliates or its employees. Our full disclosures are available here. Definitions of common statistics used in our analysis are available here (towards the bottom).
Join thousands of other readers and subscribe to our blog.