Much has been made of Factor Investing, and even Vanguard is launching a suite of actively-managed factor ETFs. But even now, with Vanguard offering factor ETFs, there are many investors that only invest passively into an index fund, such as the SP500 or EAFE index. These investors will cite the numerous studies showing that (on average) active management fails compared to an index fund (there are many studies that highlight this fact).
No arguments with most of those studies and costs clearly matter, but what I would like to highlight in this article is the following:
Even passive index investors are betting on factors.
The idea behind this article is to highlight/review a summary of the literature on factors. Many tend to forget, but the factor with the largest premium is the market factor!(1) Yes, simply investing in the market (i.e. the Sp500) is not really passive — this is a factor-investing bet. Investors in the market-beta asset class are implicitly betting on the equity-premium, which is the outsized returns (in the past) to equities over U.S. Treasury Bills (or cash).(2)
Let’s dig into a few papers that are relevant to this topic.
Factor Returns
The term “factor investing” has come to mean the following to most investors–sorting stocks and bonds on some favorable characteristic(s) that will create a different performance profile than a passive index portfolio. “Smart-beta” funds that sort stocks based on value or momentum are a classic example.(3) Factor investing exists in bonds as well, but is just not discussed as much.
And why do people invest in factors?
Typically, factors are identified when a researcher finds that going long the “good” stocks and selling the “bad” stocks earns a positive risk-adjusted premium. These so-called L/S anomaly portfolios generally have no market beta (at least on a $ amount), and receive a positive return (minus the risk-free rate) from the long/short stock portfolio.(4)
Below are the compound annual growth rates (and standard deviations) to the long/short factor portfolios from Ken French’s website and AQR’s website (for the QMJ and BAB factors). All returns are gross of any transaction costs or management fees, which would decrease the returns. Returns are from 7/1/1963 – 12/31/2016.
| SMB | HML | MOM | RMW | CMA | QMJ | BAB | |
|---|---|---|---|---|---|---|---|
| CAGR | 2.19% | 4.07% | 7.08% | 2.73% | 3.55% | 4.08% | 9.62% |
| Standard Deviation | 10.69% | 9.77% | 14.64% | 7.32% | 6.85% | 8.27% | 11.07% |
| The results are hypothetical results and are NOT an indicator of future results and do NOT represent returns that any investor actually attained. Indexes are unmanaged, do not reflect management or trading fees, and one cannot invest directly in an index. Additional information regarding the construction of these results is available upon request. | |||||||
But what about an investor in the stock market who simply uses the passive Vanguard Sp500 fund?
That person cannot be considered a factor investor, can they?
Turns out these investors are betting on an obvious factor–the market factor.
The Market Factor
So what is the market factor? The market factor has also been described as the “equity premium puzzle” in the past. The market factor was deemed a puzzle to economists, because they were unable to come up with a model that allowed for expected stock returns to be so high relative to the returns to Treasury Bills (cash-equivalent) returns. The original paper on this topic was “The equity premium: A puzzle” by Mehra and Prescott (1985) (post on the subject here).
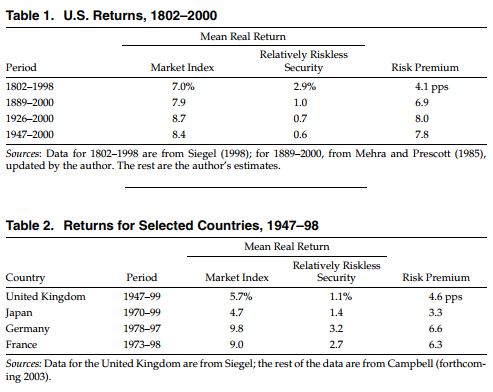
A nice summary of the premium puzzle can be found here, by Rajnish Mehra (2003). From that summary, there is a nice image indicating how large the returns to equity has been relative to cash, both over different time periods in the U.S. as well as for international markets:
The results are hypothetical results and are NOT an indicator of future results and do NOT represent returns that any investor actually attained. Indexes are unmanaged, do not reflect management or trading fees, and one cannot invest directly in an index. Additional information regarding the construction of these results is available upon request.
Note that the returns above are “real,” meaning that inflation has been deducted from the returns. As everyone can see above, there was a higher return to equities relative to cash both (1) in different time periods in the U.S. and (2) in international markets. Many papers have been written since then to attempt to explain “why” this occurs. One example found here by Benartzi and Thaler (1995), is that investors are (1) loss averse and (2) assess their portfolios often–this causes what the author’s title “myopic loss aversion.”
In general, the explanation is the following–equities are more volatile, and investors do not like volatility (who likes to potentially lose $?).
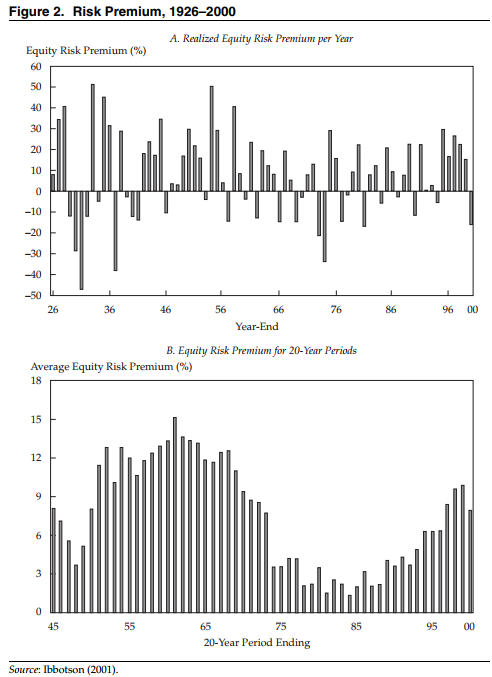
Below is the equity premium, per year and over a 20-year cycle, in the Mehra (2003) paper:

The results are hypothetical results and are NOT an indicator of future results and do NOT represent returns that any investor actually attained. Indexes are unmanaged, do not reflect management or trading fees, and one cannot invest directly in an index. Additional information regarding the construction of these results is available upon request.
What one notices is that from year to year, the equity-risk premium is generally positive, but has a lot of negative years. However, over a 20-year cycle, the premium has always been positive (in the past). And this is the offering Vanguard gives to most investors–the market factor.
Conclusion
Vanguard is moving into “factors,” but they have always been a factor investing shop–their main factor is the market factor.
And to be clear, the market factor is a reasonable factor if one has the capacity to bear (and hold onto) risk.
We would also argue (surprisingly, along with Vanguard!) that adding other factors, such as value, momentum, and trend can possibly help a portfolio capture alternative return premiums.(7)
So in the end, everyone, even a passive Sp500 Vanguard investor, is a factor investor. They are betting on generic market risk.
Hopefully, that market factor will continue to work in the future, but like all factors that expect to earn a positive premium over time, one should expect a rocky road at some point in the future!
References[+]
| ↑1 | Although MOM and BAB factors may give the market factor a run for its money (on paper) |
|---|---|
| ↑2 | Note that I focus this article on stock investing, but the same can be said about bond investing. Even passive Vanguard Bond investors are factor investors–they are investing (possibly without knowing it) in the duration/maturity factor, whereby investors generally receive a higher coupon/yield for lending money for a longer period of time. Invest in corporate or high-yield bonds through a passive Vanguard mutual fund? You are betting on the credit/default factor, whereby investors (in the past) received a higher coupon/yield on their investment for investing in lower quality debt (relative to the riskless asset–U.S. government debt). For information on these simple papers, one can review the Fama and French 1993 paper, found here. |
| ↑3 | Some other factors are quality, profitability, low volatility to name a few |
| ↑4 | This is anomalous, based on the CAPM framework, which is described in this equation: |
| ↑5 | The paper on the SMB, HML, RMW, and CMA factors, the paper on the MOM factor, the paper on the QMJ factor, and the paper on the BAB factor |
| ↑6 | It should be noted that these are the returns to long/short portfolios, while most smart-beta funds are long-only. |
| ↑7 | We are big fans of trend-following, so we have a dynamic exposure to the market-factor exposure when the equity trend is positive, described here. |
About the Author: Jack Vogel, PhD
—
Important Disclosures
For informational and educational purposes only and should not be construed as specific investment, accounting, legal, or tax advice. Certain information is deemed to be reliable, but its accuracy and completeness cannot be guaranteed. Third party information may become outdated or otherwise superseded without notice. Neither the Securities and Exchange Commission (SEC) nor any other federal or state agency has approved, determined the accuracy, or confirmed the adequacy of this article.
The views and opinions expressed herein are those of the author and do not necessarily reflect the views of Alpha Architect, its affiliates or its employees. Our full disclosures are available here. Definitions of common statistics used in our analysis are available here (towards the bottom).
Join thousands of other readers and subscribe to our blog.


