Professors John Graham and Campbell Harvey consistently put out great research. One of their innovations in financial research is their annual CFO survey (we’ve covered this research here, here, and here, if interested).
In their recent piece, the authors describe what a broad cross-section of U.S. CFOs think about the expected equity risk premium.
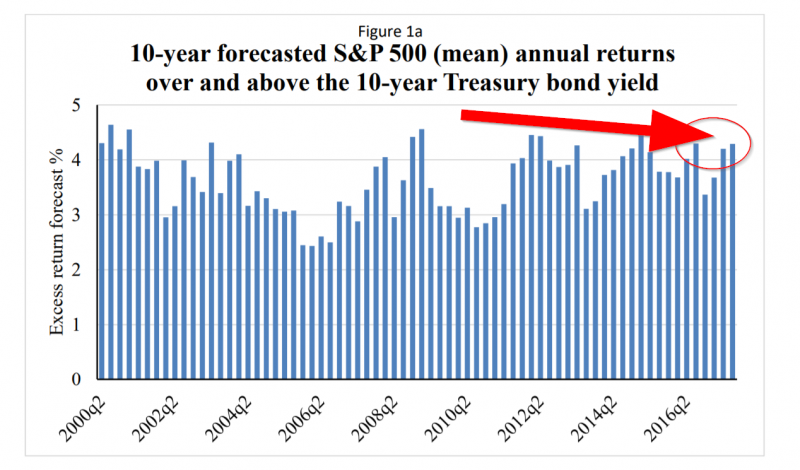
Bottom line? 4.42% real (Expected 10-Year S&P 500 total return minus the 10-Year Treasury Yield). This is pretty similar to what everyone thought on Tadas’ informal Abnormal Returns survey.(1)
That’s a pretty beefy premium and would suggest a large allocation to the stock market if one is a long-horizon investor (…and trusts the intuition from a bunch of CFOs!).
Below is the time series chart from the paper:

Not sure what the takeaway is on the estimates because 1) everyone is predicting the same thing and 2) the CFOs were predicting a low premium a few years back and the S&P 500 and has rocketed. Go figure.(2)
The Equity Risk Premium in 2018
- John Graham and Cambell Harvey
- A version of the paper can be found here.
- Want a summary of academic papers with alpha? Check out our Academic Research Recap Category.
Abstract:
We analyze the history of the equity risk premium from surveys of U.S. Chief Financial Officers (CFOs) conducted every quarter from June 2000 to December 2017. The risk premium is the expected 10-year S&P 500 return relative to a 10-year U.S. Treasury bond yield. The average risk premium is 4.42% and is somewhat higher than the average observed over the past 18 years. We also provide results on the risk premium disagreement among respondents as well as asymmetry or skewness of risk premium estimates. We also link our risk premium results to survey-based measures of the weighted average cost of capital and investment hurdle rates. The hurdle rates are significantly higher than the cost of capital implied by the market risk premium estimates.
References[+]
| ↑1 | If we back out the real equity risk premium we get 4.90% (see below for calcs). Note: A reader highlighted that the survey, while unclear on whether the forecast is real/nominal, probably could be assumed in the mind of the average survey taker to be nominal. We have also discussed this with Cam Harvey and John Graham, and they said we should assume the CFO responses were nominal. |
|---|---|
| ↑2 | Note, below was the original text of the post that has since been updated. Below, we assume that the CFOs are projecting nominal returns. Thanks to Cam Harvey and John Graham for correcting our assumption of CFOs projecting “real” returns.
Quick notes on MethodologyIf one were to go after a “real” expected return, one can subtract the expected inflation from the nominal return projection by CFOs. To get the expected inflation, we look at the difference between the 10-year Treasury (2.37% at the end of 2017) and the 10-year TIP yield at the end of 2017 (0.48% at the end of 2017), which gives 2.37% – 0.48% = 1.89% expected inflation. Thus, the real expected return would be 6.79% – 1.89% = 4.90%. December 31, 2017 TIPS yield, https://fred.stlouisfed.org/series/DFII10. |
About the Author: Wesley Gray, PhD
—
Important Disclosures
For informational and educational purposes only and should not be construed as specific investment, accounting, legal, or tax advice. Certain information is deemed to be reliable, but its accuracy and completeness cannot be guaranteed. Third party information may become outdated or otherwise superseded without notice. Neither the Securities and Exchange Commission (SEC) nor any other federal or state agency has approved, determined the accuracy, or confirmed the adequacy of this article.
The views and opinions expressed herein are those of the author and do not necessarily reflect the views of Alpha Architect, its affiliates or its employees. Our full disclosures are available here. Definitions of common statistics used in our analysis are available here (towards the bottom).
Join thousands of other readers and subscribe to our blog.

