Managerial Miscalibration
- Ben-David, Graham and Harvey
- A version of the paper can be found here.
- Want a summary of academic papers with alpha? Check out our Academic Research Recap Category.
Abstract:
Using a unique 10-year panel that includes more than 13,300 expected stock market return probability distributions, we find that executives are severely miscalibrated, producing distributions that are too narrow: realized market returns are within the executives’ 80% confidence intervals only 36% of the time. We show that executives reduce the lower bound of the forecast confidence interval during times of high market uncertainty; however, ex post miscalibration is worst during periods of high uncertainty. We also find that executives who are miscalibrated about the stock market show similar miscalibration regarding their own firms’ prospects. Finally, firms with miscalibrated executives seem to follow more aggressive corporate policies: investing more and using more debt financing.
Alpha Highlight:
“Miscalibration” is defined as excessive confidence about having accurate information (Alpert and Raiffa, 1982).
This paper conducted quarterly surveys on finance professionals, most of whom are CFOs of mid-size and large US firms. This research covered a 10 year stretch (June 2001-March 2011) and historical surveys/responses can be found at http://www.cfosurvey.org/.
The basic question on the survey is below:
- Over the next year, I expect the annual S&P 500 return will be:
- There is a 1-in-10 chance the actual return will be less than ___%
- I expect the return to be: ___%
- There is a 1-in-10 chance the actual return will be greater than ___%
The second question is similar, but initial words change to “Over the next 10 years, I expect the average annual S&P 500 return will be.” So the first question asks about short-term return prediction and the second question targets long-term return prediction.
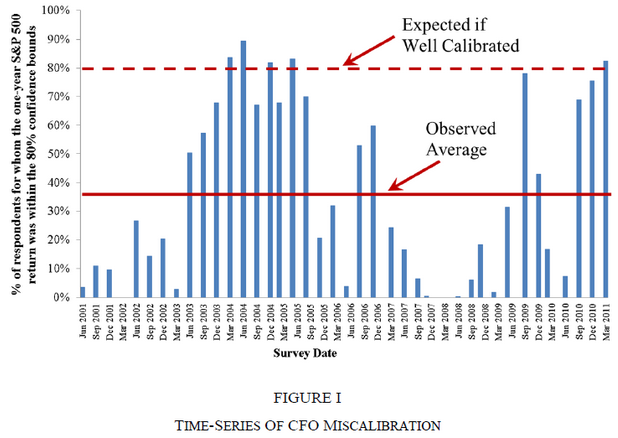
The authors deliberately gather upper bound (90th) and lower bound (10th) answers and do not require participants to provide symmetric confidence intervals. We can interpret wider confidence intervals as higher subjective uncertainty about estimation; while we can interpret narrower confidence intervals as higher subjective confidence about estimation. If CFOs were well calibrated, their 80% confidence intervals would include the correct answer 80% of the time. Over the 10 years, the authors collected 13,300 CFO forecasts of the S&P 500 from the surveys.
Key Findings:
Return Forecasts: CFOs are severely miscalibrated. The realized one-year S&P 500 returns are within the CFOs’ 80% confidence intervals only 36.3% of the time! Even during the least volatile quarter, this number is just 59%.
CFOs appear somewhat less miscalibrated when making long-term forecasts.
The results are hypothetical results and are NOT an indicator of future results and do NOT represent returns that any investor actually attained. Indexes are unmanaged, do not reflect management or trading fees, and one cannot invest directly in an index. Additional information regarding the construction of these results is available upon request.
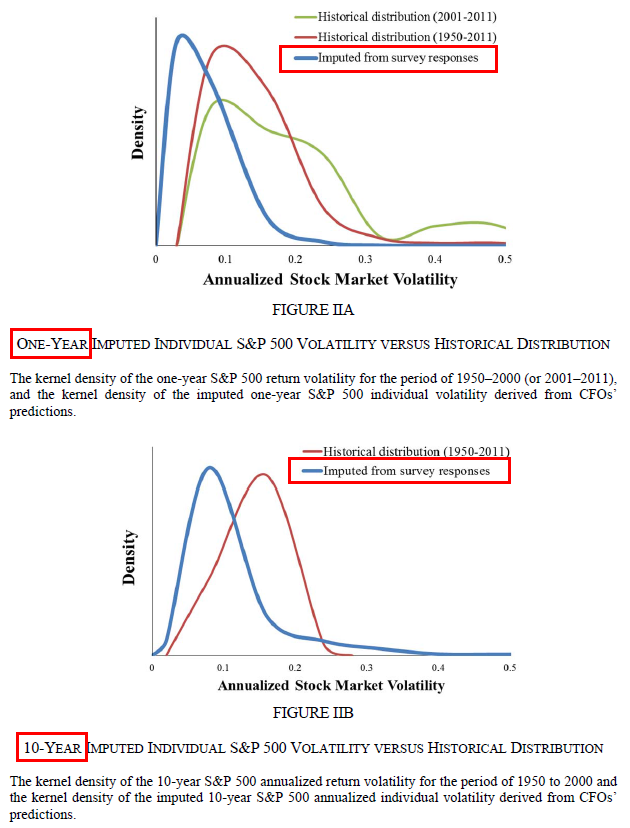
Volatility Forecasts: The paper also calculates CFOs’ individual volatility estimates and distribution, then compare it to the historical volatility distribution. The figure below shows that CFOs’ one-year imputed volatilities center at 4%, while historical volatility centers at 12%. 58% of the CFOs’ imputed individual volatilities are lower than 5.1% — an extraordinarily low estimate given the historical data.
Ten-year (long-term) volatility forecasts are also miscalibrated, but to a lesser degree.
Imputed individual volatility formula: For confidence intervals of 80% in a normal distribution, Z equals 2.65.
The results are hypothetical results and are NOT an indicator of future results and do NOT represent returns that any investor actually attained. Indexes are unmanaged, do not reflect management or trading fees, and one cannot invest directly in an index. Additional information regarding the construction of these results is available upon request.
More findings:
- CFOs in the survey are overconfident.
- CFOs who are miscalibrated about the stock market show similar miscalibration regarding their own firms’ corporate planning and forecasting (such as projects’ IRR forecasts).
- More miscalibrated managers invest more and tolerate higher leverage.
About the Author: Wesley Gray, PhD
—
Important Disclosures
For informational and educational purposes only and should not be construed as specific investment, accounting, legal, or tax advice. Certain information is deemed to be reliable, but its accuracy and completeness cannot be guaranteed. Third party information may become outdated or otherwise superseded without notice. Neither the Securities and Exchange Commission (SEC) nor any other federal or state agency has approved, determined the accuracy, or confirmed the adequacy of this article.
The views and opinions expressed herein are those of the author and do not necessarily reflect the views of Alpha Architect, its affiliates or its employees. Our full disclosures are available here. Definitions of common statistics used in our analysis are available here (towards the bottom).
Join thousands of other readers and subscribe to our blog.