Quantifying Backtest Overfitting in Alternative Beta Strategies
- Antti Suhonen, Matthias Lennkh, and Fabrice Perez
- Journal of Portfolio Management, Winter 2017
- A version of this paper can be found here
- Want to read our summaries of academic finance papers? Check out our Academic Research Insight category.
What are the Research Questions?
- Does persistence (out of sample performance) exist for alternative beta strategies sponsored by investment banks?
- Does adding complexity to a strategy increase the risk of backtesting overfitting?
- Do the strategies capture the factor exposure they seek to exploit? And, does the exposure remain consistent between backtesting and live periods?
What are the Academic Insights?
By analyzing a proprietary dataset of around 215 individual strategy indices across 17 sponsoring investment banks with both backtest and live data (the minimum length of the backtest is 3.3 years while the average is 10.7 years; the minimum length for the live period is 0.44 years while the average is 4.6 years), the authors find the following:
- Most of the strategies exhibit a substantial reduction in Sharpe ratios (SR) in the live period. This reduction is due to a falling in excess returns. The haircut is at 50% or more for all asset classes and at 60% or more for all strategy groups. Only 18 of 215 strategies ( or 8.4% of the sample) had a live SR equal to or greater than the backtested one. Also, 65 strategies (or 30% of the sample) had a negative SR during the live period. (similar to the analysis in “Chasing Returns and Avoiding Spaghetti Against the Wall Fund Companies“)
- YES, more complex trading strategies are more liable to overfitting, and deteriorated performance. After controlling for fixed effects, the most complex strategies suffer from an SR haircut that this more than 30% compared to simpler strategies. (see here for the reasons why)
- The equity value strategies display a positive and significant exposure to the value factor, which becomes insignificant and negative in the live period. Differently, the equity volatility strategy, the fixed income curve strategy, and FX carry strategy show consistent exposures both in the backtest and live periods.
Why does it matter?
This study contributes to an emerging body of research on backtest overfitting in alternative beta strategies. In fact, it focuses on a very particular dataset: strategies sold by investment banks. The findings highlight the importance of due diligence on quantitative strategies (which we also highlighted in the past here) and suggest that backtested performance need to be taken with a grain of salt when selecting a strategy. The authors conclude by suggesting two further readings: Principal for Financial Benchmarks (IOSCO, 2013) and Financial Benchmarks: Thematic Review of Oversights and Control (FCA, 2015).
The Most Important Chart from the Paper:
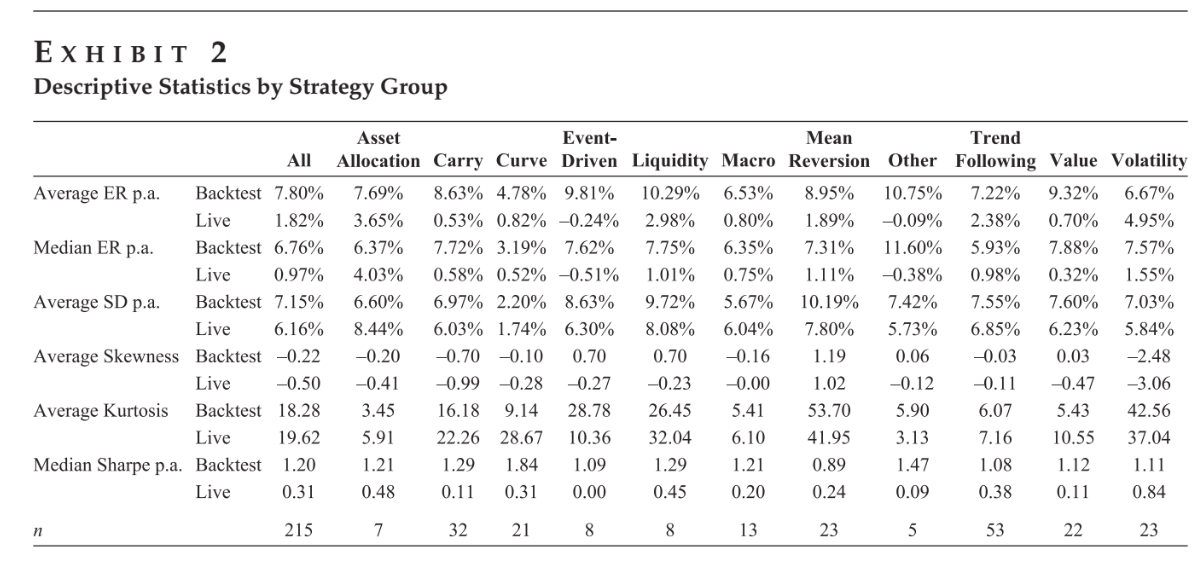
The results are hypothetical results and are NOT an indicator of future results and do NOT represent returns that any investor actually attained. Indexes are unmanaged, do not reflect management or trading fees, and one cannot invest directly in an index.
Abstract
The authors investigate the biases in the backtested performance of “alternative beta” strategies using a unique sample of 215 trading strategies developed and promoted by global investment banks. Their results lend support to the cautions in the recent literature regarding backtest overfitting and lack of robustness in trading strategy performance during the “live” period (out of sample). The authors report a median 73% deterioration in Sharpe ratios between backtested and live performance periods for the strategies, and they establish a link between performance deterioration and strategy complexity, with the realized reduction in live versus backtested Sharpe ratios of the most complex strategies exceeding those of the simplest ones by over 30 percentage points. The robustness of strategy exposure to risk factors varies between asset classes and strategies; it appears reasonable in equity volatility and FX carry strategies but quite weak in the equity value strategy in particular.
About the Author: Wesley Gray, PhD
—
Important Disclosures
For informational and educational purposes only and should not be construed as specific investment, accounting, legal, or tax advice. Certain information is deemed to be reliable, but its accuracy and completeness cannot be guaranteed. Third party information may become outdated or otherwise superseded without notice. Neither the Securities and Exchange Commission (SEC) nor any other federal or state agency has approved, determined the accuracy, or confirmed the adequacy of this article.
The views and opinions expressed herein are those of the author and do not necessarily reflect the views of Alpha Architect, its affiliates or its employees. Our full disclosures are available here. Definitions of common statistics used in our analysis are available here (towards the bottom).
Join thousands of other readers and subscribe to our blog.