King of the Mountain: The Shiller P/E and Macroeconomic Conditions
- Robert D. Arnott, Denis B. Chaves, and Tzee-man Chow
- Journal of Portfolio Management
- A version of this paper can be found here
- Want to read our summaries of academic finance papers? Check out our Academic Research Insight category
What are the research questions?
- Is there a relationship between real yields and short-term market valuation?
- Is there a relationship between inflation rates and short-term market valuation?
- Does the predictive power of the Shiller P/E improve by using yields and inflation?
What are the Academic Insights?
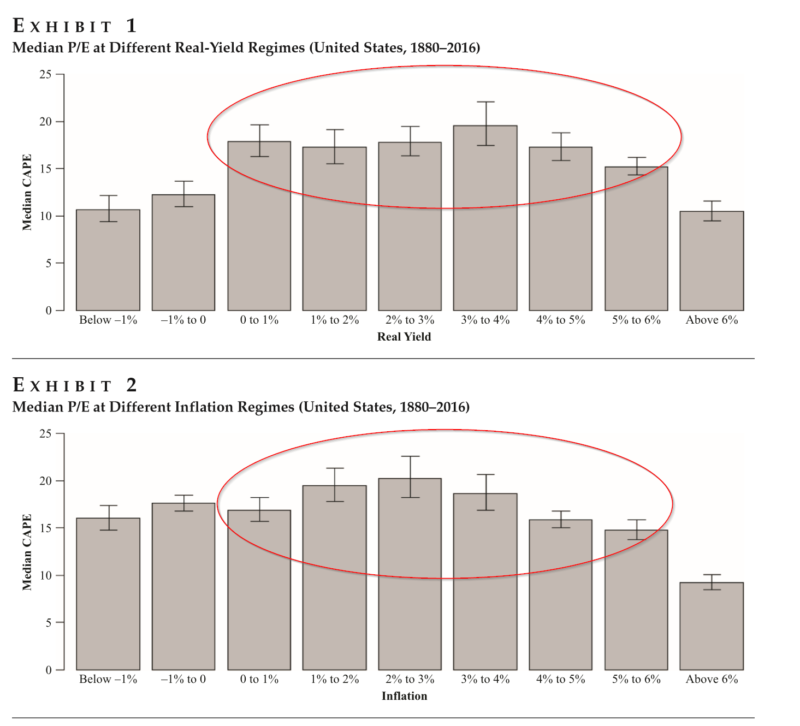
- YES. The authors describe a “mountain-shaped” relationship between stock market valuations and inflation rates and real yields. When levels of inflation and real yields are moderate, then the Market P/E rises above 16.7 (the unconditional historical average). When inflation or the real yield reside at extreme levels, the P/E is noticeably lower. For the U.S., the Market P/E is generally at it’s highest when real yields are approximately 3% to 4%. When real yields are below 1% or above 6%, the P/E drops from 19.6 to 10.7. Outside this narrow interval, median P/Es fall rather quickly from a peak of 19.6 to 10.7 when real yields are below -1% and to 10.5 when real yields are above 6%.
- YES. A similar pattern exists for inflation as does for real yields, relative to market valuation. The median market P/E of 20.3 occurs when inflation is between 2% and 3%. However, as inflation increases the P/E declines faster than that observed for real yields. On the other side, the authors do not observe a steep decline in the P/E when the inflation rate also declines. Perhaps an equity investment is not as effective as a hedge against inflation as conventional wisdom suggests.
- YES. Using a regression model with a defined Gaussian function conditional on current levels of inflation and real yields provides superior forecasts for forecast horizons of 3 years or less. At longer horizons, the conditional model produces inferior results for periods of 3 to 5 years or longer. At that span, the basic Shiller P/E model maintains its impressive well-documented performance.
Why does it matter?
Although the insights provided by the analysis of the patterns observed for inflation and yields are interesting in and of themselves, the question of whether or not they add predictive value is of practical significance. Since the results in terms of enhancement are limited to a 3 to 5-year investment horizon, using a conditional model based on current yields or current inflation to forecast longer-term horizons would not be advisable. This is not surprising as yields and inflation change over time, and today’s value are more than likely to differ 5 or more years out.(1)
Not to be overlooked, the methodology developed in this paper demonstrates that there are very effective ways, in comparison to standard linear regression approaches, to combine macro variables with a market P/E not only in the U.S., but across a number of developed markets. While the Shiller P/E is a powerful tool for the long term, it is also useful for forecasting short-term market returns using nonlinear methods. The authors are succinct on this point:
We need no longer rely on long-term historical averages to infer near-term mean-reversion targets.
The most important chart from the paper

The results are hypothetical results and are NOT an indicator of future results and do NOT represent returns that any investor actually attained. Indexes are unmanaged and do not reflect management or trading fees, and one cannot invest directly in an index.
Abstract
Because of mean reversion, the Shiller cyclically adjusted price/earnings (P/E) ratio is a powerful predictor of long-horizon capital market returns. Like other valuation metrics, however, it is a poor predictor of short-term returns. The authors find that this is because the “normal” level of the Shiller P/E ratio varies with economic conditions. Other researchers have shown that while periods of moderate real interest rates allow higher market valuations, P/Es tend to fall when real rates are high or low. The present authors show a similar linkage between P/Es and inflation. Moderate, rather than rock-bottom, levels of inflation and real interest rates are associated with the highest valuation multiples, creating a valuation “mountain.” The authors also extend these findings to international developed markets. They further demonstrate that the P/E ratio becomes a statistically significant and economically meaningful predictor of shorter-term returns under the assumption that P/Es mean-revert toward the levels suggested by prevailing macroeconomic conditions rather than toward long-term averages.
About the Author: Tommi Johnsen, PhD
—
Important Disclosures
For informational and educational purposes only and should not be construed as specific investment, accounting, legal, or tax advice. Certain information is deemed to be reliable, but its accuracy and completeness cannot be guaranteed. Third party information may become outdated or otherwise superseded without notice. Neither the Securities and Exchange Commission (SEC) nor any other federal or state agency has approved, determined the accuracy, or confirmed the adequacy of this article.
The views and opinions expressed herein are those of the author and do not necessarily reflect the views of Alpha Architect, its affiliates or its employees. Our full disclosures are available here. Definitions of common statistics used in our analysis are available here (towards the bottom).
Join thousands of other readers and subscribe to our blog.

