The 2014 study by Andrea Frazzini and Lasse Heje Pedersen, “Betting Against Beta,” found strong support for low-beta strategies. I’ve previously written on low-beta strategies here. This paper finds that, for U.S. stocks, the betting against beta (BAB) factor (a portfolio that holds low-beta assets, leveraged to a beta of 1, and that shorts high-beta assets, de-leveraged to a beta of 1) realized a Sharpe ratio of 0.75 between 1926 and 2009. That is about twice the Sharpe ratio of the value effect and 40% higher than that of momentum over the same period.
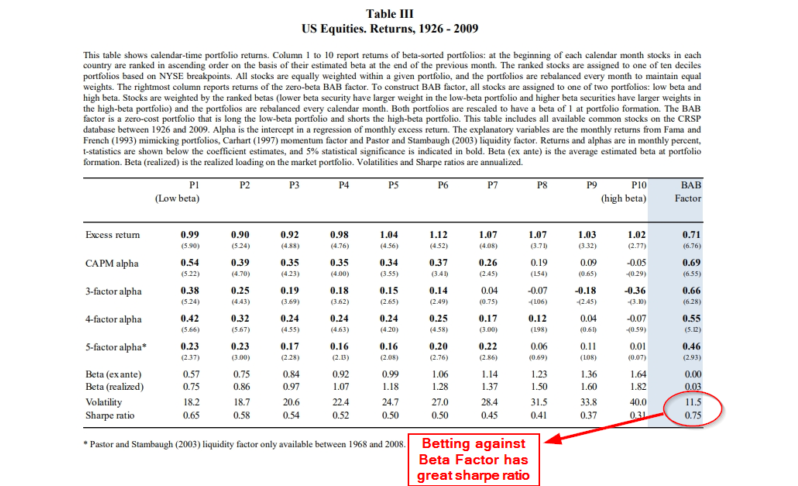
They also found that the BAB factor has highly significant risk-adjusted returns after accounting for its realized exposure to the market beta, value, size, momentum, and liquidity factors. In fact, BAB realized a significant positive return in each of the four 20-year subperiods between 1926 and 2009.
Additionally, their analysis of 19 international equity markets revealed similar results. The authors further found that BAB returns have been consistent across countries, across time, within deciles sorted by size, and within deciles sorted by idiosyncratic risk, as well as consistently robust to a number of specifications. These consistent results suggest that coincidence or data mining are unlikely explanations.
As further supporting evidence, Frazzini and Pedersen found that in each asset class they examined (stocks, U.S. Treasury bonds, credit markets, and futures markets for currencies and commodities), alphas and Sharpe ratios declined almost monotonically as beta increased. They concluded the following:
This finding provides broad evidence that the relative flatness of the security market line is not isolated to the U.S. stock market but that it is a pervasive global phenomenon. Hence, this pattern of required returns is likely driven by a common economic cause.
The Intuition for the BAB Anomaly
The intuition behind the BAB anomaly is that there are leverage-constrained investors who, instead of applying leverage to obtain an expected return higher than the market’s expected return, overweight high-beta stocks and underweight low-beta stocks in their portfolios. Their actions lower future risk-adjusted returns on high-beta stocks and increase future risk-adjusted returns on low-beta stocks.
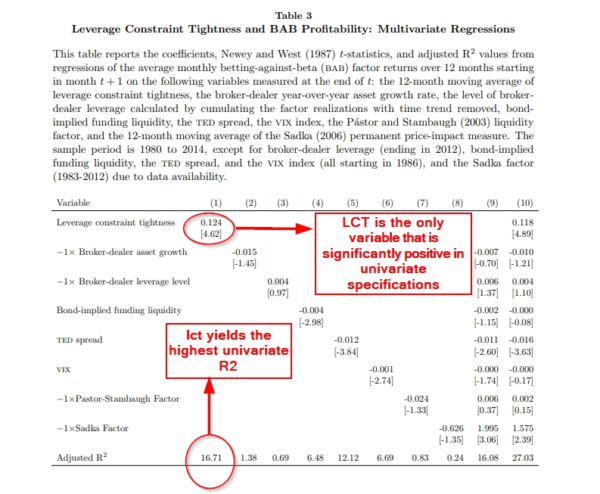
Oliver Boguth and Mikhail Simutin contribute to the literature on the BAB anomaly with the study “Leverage Constraints and Asset Prices: Insights from Mutual Fund Risk Taking,” which appears in the February 2018 issue of the Journal of Financial Economics and can be found here. They studied the pricing implications of leverage constraints using a measure of revealed borrowing demand that relies on financial intermediaries unaffected by fluctuations in the lending market (mutual funds).
Boguth and Simutin write:
These investors face borrowing restrictions established by the Investment Company Act of 1940 and often self-impose stringent zero-leverage constraints. As a result, supply-based measures such as the cost of borrowing do not directly apply to them (only a small percentage of mutual funds use leverage). Because leverage restrictions shut down the supply channel, fluctuations in the demand for borrowing of mutual funds reveal the tightness of leverage constraints.
The authors “argue that the observable risk taken on by mutual funds reveals their demand for borrowing and hence the unobservable tightness of the constraint.” To estimate this risk, they “calculate the value-weighted average beta of the aggregate stock holdings of all actively managed equity funds.” Their data sample covers the period from 1981 through 2014.
The following is a summary of their findings:
- The average beta of mutual funds correlates with existing measures of funding conditions, such as broker-dealer asset growth and stock and bond liquidity.
- Their measure of leverage constraint tightness (LCT) strongly and significantly predicts returns of the BAB factor, which is long levered low-beta stocks and short de-levered high-beta stocks.

The results are hypothetical results and are NOT an indicator of future results and do NOT represent returns that any investor actually attained. Indexes are unmanaged, do not reflect management or trading fees, and one cannot invest directly in an index. Additional information regarding the construction of these results is available upon request.
- Growth firms have higher LCT exposures, as evidenced by the negative coefficient on book-to-market and the positive coefficient on asset growth. This is consistent with investors attempting to overcome their explicit leverage constraints by using the leverage embedded in growth options.
- Exposure to changes in LCT strongly and negatively predicts fund performance in the cross-section of returns and the magnitude of the effect is economically large.
- The decile of funds with the lowest LCT exposures generates monthly excess returns of 0.82%, while the highest decile earns just 0.31%. The difference, approximately 6% annually, is statistically significant at the 1% confidence level after controlling for standard risk factors. Furthermore, the effect is not confined to extreme deciles. Rather, fund returns decrease monotonically with LCT exposure.
- The negative relation between LCT loadings and future fund performance remains large in gross-of-fees returns. It is robust to controlling for fund characteristics and determinants of mutual fund performance from prior literature as well as to alternative estimation approaches.
- Following times of non- or weakly-binding constraints (low LCT), the future one-month BAB return is 0.71%. It is much larger, at 1.18%, after periods of tight leverage constraints. The relation is similar over horizons of up to 12 months.
The finding of time-varying returns to BAB is consistent with the findings from Esben Hedegaard’s June 2018 study, “Time-Varying Leverage Demand and Predictability of Betting-Against-Beta.” Hedegaard found that high (low) past returns on the market forecast high (low) future returns on the BAB factor—realized BAB returns are higher (lower) following high (low) past market returns.
The results are hypothetical results and are NOT an indicator of future results and do NOT represent returns that any investor actually attained. Indexes are unmanaged, do not reflect management or trading fees, and one cannot invest directly in an index. Additional information regarding the construction of these results is available upon request.
Because expected returns move opposite to prices, high (low) market returns lead to contemporaneously low (high) returns on the BAB factor. His results held for both U.S. BAB returns and 23 international country BAB returns, as well as for BAB factors formed from country indices. He also found that the economic magnitude is large, with a coefficient of 0.41 on the past 12-month average BAB return. A 10% return over the past 12 months predicts an abnormal 4% annualized return on the BAB factor over the next month.
Boguth and Simutin hypothesized that what drives the inverse relation between LCT exposures and future mutual fund returns is that “an asset that pays off when constraints tighten provides capital when it is most valuable and should carry a negative risk premium.”
Summary
The strong pattern in the time-series and cross-country variation of expected returns shows that while low-beta stocks outperform high-beta stocks on average, on a risk-adjusted basis, the outperformance is stronger when and where past liquidity funding constraints are high. It’s also stronger when past market returns are high.
These findings have important implications for investors. When past returns are high, the risks of owning high-beta stocks significantly increase. Investors in actively managed mutual funds should make sure they fully understand their fund’s time-varying level of exposure to market beta and know how it changes during periods of strong performance.
Forewarned is forearmed.

About the Author: Larry Swedroe
—
Important Disclosures
For informational and educational purposes only and should not be construed as specific investment, accounting, legal, or tax advice. Certain information is deemed to be reliable, but its accuracy and completeness cannot be guaranteed. Third party information may become outdated or otherwise superseded without notice. Neither the Securities and Exchange Commission (SEC) nor any other federal or state agency has approved, determined the accuracy, or confirmed the adequacy of this article.
The views and opinions expressed herein are those of the author and do not necessarily reflect the views of Alpha Architect, its affiliates or its employees. Our full disclosures are available here. Definitions of common statistics used in our analysis are available here (towards the bottom).
Join thousands of other readers and subscribe to our blog.