One of the big problems for the first formal asset pricing model developed by financial economists, the Capital Asset Pricing Model (CAPM), was that it predicts a positive relationship between risk and return. However, the historical evidence demonstrates that, while the slope of the security market line is generally positive (higher-beta stocks provide higher returns than low-beta stocks), it is flatter than the CAPM suggests.
Importantly, the quintile of stocks with the highest beta meaningfully underperform stocks in the lowest-beta quintile in both U.S. and international markets — the highest-beta stocks provide the lowest returns while experiencing much higher volatility. Over the last five decades, defensive stocks have delivered higher returns than the most aggressive stocks, and defensive strategies, at least those based on volatility, have delivered significant Fama-French three-factor (market beta, size, and value) alphas. This runs counter to economic theory, which predicts that higher expected risk is compensated with a higher expected return.
The low-volatility anomaly has been demonstrated to exist in equity markets around the globe. What’s interesting is that this finding is true not only for stocks, but for bonds as well. The academic research, combined with the 2008 bear market, has led to low-volatility strategies becoming the darling of investors.
For example, as of October 2017, there were seven ETFs with at least $1 billion in AUM:
- iShares MSCI USA Minimum Volatility Index Fund (USMV): $14.2 billion
- iShares MSCI EAFE Minimum Volatility Index Fund (EFAV): $7.6 billion
- PowerShares S&P 500 Low Volatility Portfolio (SPLV): $7.2 billion
- iShares MSCI Emerging Markets Minimum Volatility Index Fund (EEMV): $4.2 billion
- iShares MSCI All Country World Minimum Volatility Index Fund (ACWV): $3.5 billion
- PowerShares S&P MidCap Low Volatility Portfolio (XMLV): $1.2 billion
- PowerShares S&P Small Cap Low Volatility Portfolio (XSLV): $1.8 billion
There were 15 more with at least $100 million of AUM (source).
There are three main explanations offered for the low-volatility anomaly:
- Many investors are either constrained against the use of leverage or have an aversion to its use. Such investors who seek higher returns do so by investing in high-beta stocks, despite the fact that the evidence shows that they have delivered poor risk-adjusted returns. Limits to arbitrage and aversion to shorting, as well as the high cost of shorting such stocks, prevent arbitrageurs from correcting the pricing mistake.
- There are individual investors who have a “taste” for lottery-like investments. This leads them to “irrationally” invest in high-volatility stocks (which have lottery-like distributions) despite their poor returns. They pay a premium to gamble.
- Mutual fund managers who are judged against benchmarks have an incentive to own higher-beta stocks. In addition, managers’ bonuses are options on the performance of invested stocks, and thus more valuable for high-volatility stocks.
Explaining the Low-Volatility Factor
Some recent papers, including Robert Novy-Marx’s 2016 study, “Understanding Defensive Equity,” and Eugene Fama and Kenneth French’s 2015 study, “Dissecting Anomalies with a Five-Factor Model,” argue that the low-volatility and low-beta anomalies are well-explained by asset pricing models that include the newer factors of profitability and investment (in addition to market beta, size and value). For example, Fama and French write in their paper that when using their five-factor model, the “returns of low volatility stocks behave like those of firms that are profitable but conservative in terms of investment, whereas the returns of high volatility stocks behave like those of firms that are relatively unprofitable but nevertheless invest aggressively.” They add that positive exposure to RMW (the profitability factor, or robust minus weak) and CMA (the investment factor, or conservative minus aggressive) also go a long way toward capturing the average returns of low-volatility stocks, whether volatility is measured by total returns or residuals from the Fama-French three-factor model.
Ciliberti Stefano, Yves Lemperiere, Alexios Beveratos, Guillaume Simon, Laurent Laloux, Marc Potters and Jean-Philippe Bouchaud provide the latest contribution to the literature on the low-volatility/low-beta anomaly with the study “Deconstructing the Low Anomaly,” which appears in the Fall 2017 issue of The Journal of Portfolio Management (online copy available here). Depending on the market, their study covered the period from (market in parentheses) 1970 (U.S.), 2002 (Europe), 2001 (U.K.), 1993 (Japan), 2002 (Australia), 2001 (Canada), 2002 (Hong Kong) and 2001(Brazil) through July 16, 2015.
The following is a summary of their findings:
- They confirmed the strength and persistence of the low-volatility and low-beta effect on a pool of nine different countries, and found that the two anomalies are very strongly correlated (about 0.9). This suggests “that these two anomalies are in fact one and the same.”
- The skewness of low-volatility portfolios is small but systematically positive, suggesting that the low-volatility excess returns cannot be identified with a hidden risk-premium.
- The profitability of the low-volatility/low-beta strategy is negatively correlated with the size factor (-0.6/-0.3) and positively correlated with the three value factors studied, book-to-price (0.2/0.3), dividend-to-price (0.6/0.6) and earnings-to-price (0.5/0.4). There is virtually no correlation with the momentum factor. Once the common factors of value and profitability are controlled for, the performance of low volatility/low beta becomes insignificant. (A similar finding is identified in the U.S. market.)
- U.S. mutual funds are systematically overexposed to high-volatility/small-cap stocks and underexposed to low-volatility/large-cap stocks, in agreement with the aforementioned leverage constraint and/or bonus incentives explanations.
Another important insight was that, due to the borrowing required to short stocks, the profitability of the strategies is sensitive to the financing rate — they performed poorly in the high-rate environment of the 1970s and they have benefited from the low-rate environment of the last decade. All of these findings are consistent with those of the prior literature, including the sensitivity to interest rates. Ronnie Shah, author of the 2011 paper “Understanding Low Volatility Strategies: Minimum Variance,” found that for the period from 1973 through June 2010, the low-beta strategy has statistically significant exposure to term risk.
The authors also noted that the dividend factor (D/P) has significant explanatory power for the performance of the low-volatility/low-beta strategies — a point that has not been discussed in the literature despite its importance for taxable investors, as high-dividend strategies are tax inefficient. Thus, the excess return of the strategy (or a significant portion of it) could be eaten up by taxes on dividends. The reason is that the low-volatility stocks the strategy is long, receive on average higher dividends than high-volatility stocks the strategy is short.
The authors explain why this is the case:
One argument could be that since high-vol, ‘glittering’ stocks are attractive because of all the biases mentioned in the introduction, low vol ‘boring’ stocks must somehow compensate by offering larger dividends. A slight variation on this idea is that mature businesses pay dividends whereas growing (risky) firms do not. However, the causality could be reversed: not surprisingly, we find a similar negative correlation between earnings and volatility. One could thus argue that strong earnings and regular dividends make firms less risky and therefore less volatile.
Before summarizing, using the regression tool at Portfolio Visualizer, I’ll analyze the performance of USMV through a factor model lens to see if the results are consistent with the academic research we have reviewed. In addition to the previously discussed equity factors, I’ve included in the analysis of fixed income factors because the research shows that low volatility has exposure to term risk. The loadings on each factor are in parentheses. Data is available for the period from November 2011 through August 2017.
The table presents the annualized alphas.
| Factors | Annualized Alphas (%) |
| CAPM Beta (0.6) | +5.5 |
| Beta (0.7), Size (-0.4), Value (-0.1) | +3.7 |
| Beta (0.8), Size (-0.2), Value (0.1), Momentum (0.2), Quality (0.2), Low Beta (0.2) | -1.5 |
| Beta (0.9), Size (-0.2), Value (0.2), Momentum (0.1), Quality (0.2), Low Beta (0.2), Term (0.3), Credit (-0.1) | -3.0 |
We see similar results looking at the performance of the PowerShares S&P MidCap Low Volatility Portfolio (XMLV). The period covers the time for which data is available, from March 2013 through August 2017.
| Factors | Annualized Alphas (%) |
| CAPM Beta (0.7) | +5.1 |
| Beta (0.8), Size (0.0), Value (-0.1) | +4.7 |
| Beta (0.9), Size (0.2), Value (0.3), Momentum (0.2), Quality (0.2), Low Beta (0.5) | -2.7 |
| Beta (0.9), Size (0.4), Value (0.3), Momentum (0.2), Quality (0.3), Low Beta (0.2), Term (0.4), Credit (0.0) | -2.9 |
| Factors | Annualized Alphas (%) |
| CAPM Beta (0.9) | +4.1 |
| Beta (0.7), Size (0.6), Value (0.1) | +7.1 |
| Beta (1.0), Size (1.0), Value (0.6), Momentum (0.2), Quality (0.6), Low Beta (0.5) | -3.4 |
| Beta (0.9), Size (1.0), Value (0.5), Momentum (0.3), Quality (0.7), Low Beta (0.3), Term (0.1), Credit (0.2) | -3.4 |
Summary
Research has provided persistent and pervasive evidence that the low-volatility anomaly, at least in stocks, is well explained by other common factors, specifically the value factors of D/P and E/P, the profitability and investments factors, and the term factor. This makes the low-volatility factor redundant for portfolios that already have exposures to these factors. Stefano, Lemperiere, Beveratos, Simon, Laloux, Potters and Bouchaud concluded: “While the low vol(/low-β) effect is indeed compelling in equity markets, it is not a real diversifier in a factor driven portfolio that already has exposure to Value type strategies, in particular Earning-to-Price and Dividend-to-Price.”
Investors should also be concerned that the tremendous popularity of low-volatility strategies has altered their nature (such as having significant exposure to value). The table below shows the P/E ratios for the U.S. low-volatility/low-beta ETFs with the largest AUM in large-cap, mid-cap and small-cap stocks and compares them to Vanguard’s market and value ETFs in the same asset class. Data is from Morningstar.
| ETF | P/E |
| iShares MSCI USA Minimum Volatility Index Fund (USMV) | 19.1 |
| Vanguard Total Market (VTI) | 17.1 |
| Vanguard Value (VTV) | 14.5 |
| PowerShares S&P MidCap Low Volatility Portfolio (XMLV) | 21.1 |
| Vanguard Mid-Cap (VO) | 17.8 |
| Vanguard Mid-Cap Value (VOE) | 14.6 |
| PowerShares S&P Small Cap Low Volatility Portfolio (XSLV) | 19.5 |
| Vanguard Small-Cap (VB) | 17.3 |
| Vanguard Small-Cap Value (VBR) | 14.9 |
The Curse of Popularity
The cash flows resulting from popularity have not only removed the exposure of low-volatility stocks to the value factor, but the strategies have now become significantly more growth-oriented than even the overall market for large-, mid- and small-cap stocks. This is important information, as you’ll see
Historically, there is a clear relationship between valuation and low-volatility strategies. The paper “Low-Volatility Cycles,” published in a 2015 issue of the CFA Institute’s Financial Analysts Journal, summarizes the situation (summary here). The authors write: “Our results suggest time-variation in the performance of low-risk strategies is likely influenced by the approach to constructing the low-risk portfolio strategy and by the market environment and associated valuation premia.”
The table below from the study highlights the key result:
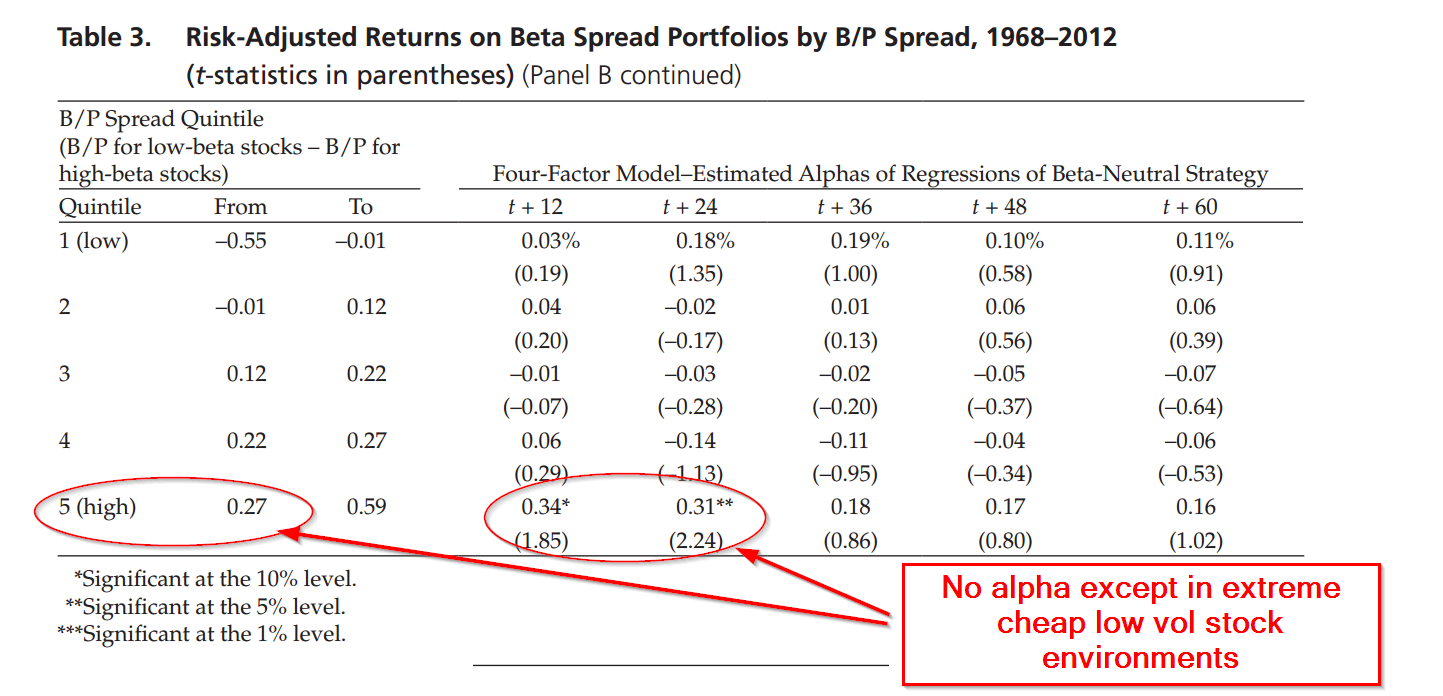
A 2012 paper by Pim van Vliet, “Enhancing a Low Volatility Strategy is Particularly Helpful When Generic Low Volatility is Expensive,” highlights a similar finding. These authors show that for the period from 1929 through 2010, while on average low-volatility strategies tend to have exposure to the value factor, that exposure is time-varying. The low-volatility factor spends about 62 percent of the time in a value regime and 38 percent of the time in a growth regime. The regime-shifting behavior impacts the performance of low-volatility strategies. When low-volatility stocks have value exposure, on average they outperformed the market by 2.0 percent. However, when low-volatility stocks have growth exposure, they have underperformed by 1.4 percent on average.
The bottom line is that investors in low-volatility strategies should be aware not only of current valuations, but, for taxable investors, the negative tax impact of dividends as well.
About the Author: Larry Swedroe
—
Important Disclosures
For informational and educational purposes only and should not be construed as specific investment, accounting, legal, or tax advice. Certain information is deemed to be reliable, but its accuracy and completeness cannot be guaranteed. Third party information may become outdated or otherwise superseded without notice. Neither the Securities and Exchange Commission (SEC) nor any other federal or state agency has approved, determined the accuracy, or confirmed the adequacy of this article.
The views and opinions expressed herein are those of the author and do not necessarily reflect the views of Alpha Architect, its affiliates or its employees. Our full disclosures are available here. Definitions of common statistics used in our analysis are available here (towards the bottom).
Join thousands of other readers and subscribe to our blog.