Volatility Lessons
- Eugene F. Fama and Kenneth R. French
- Financial Analysts Journal
- A version of this paper can be found here
- Want to read our summaries of academic finance papers? Check out our Academic Research Insight category
What are the research questions?
The main purpose of this study was to examine the changes in the distribution of the US equity risk premium as the return horizon varies over the short term, medium and long term (see here for a piece that covers those topics). In this recap, we look at ancillary analysis from the “Volatility Lessons” paper, with a specific focus on the risk premiums associated with “Size'” and “Value” as combined factors; three Value universes (Market Value, Large Cap Value, and Small Cap Value); and Small Cap stocks. The research questions related to this analysis are outlined below:
- How similar are the distributions of Value and SmallCap factor premiums relative to those of the equity premium?
- Is the expected risk premium observed to be negative for any holding period for any of the factor premiums?
- Are the chances of a negative outcome significant for the universes of Value and Size factor premiums?
What are the Academic Insights?
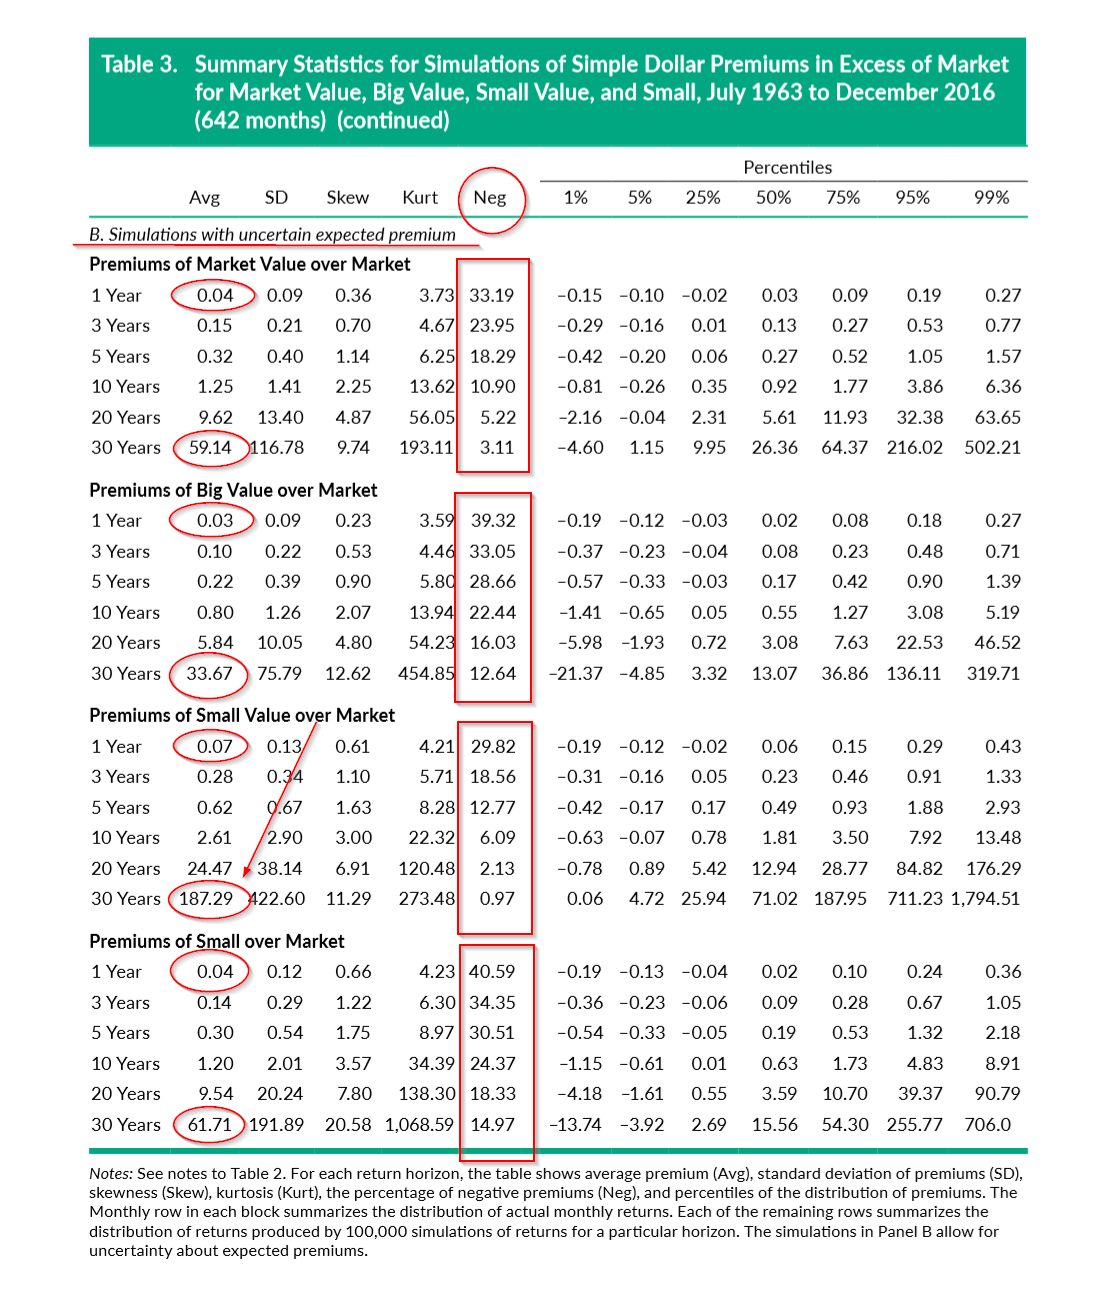
- VERY. As with the equity premium the distributions over longer horizons are more volatile, they are skewed to the right, and exhibit increasing kurtosis (become more peaked). From shorter to longer horizons the factor premiums move faster to the right than the increase in their volatility occurs. The right tail essentially spreads out more than the left tail spreads, consequently, outliers are for the most part positive outcomes. An examination of the 5th and 95th percentiles in Table 3 shows the asymmetry in dollar terms.
- NO. For the simulation with an uncertain mean, the average premiums were: Market Value: .04(1yr HP) and 59.14 (30yr HP): Big Value: .03 (1yr HP) and 33.67 (30 yr HP); SmallCap Value: .07 (1 yr HP) and 187.29 (30 yr HP); SmallCap: .04 (1 yr HP) and 61.71 (30 yr HP).
- YES. Similar to the equity premium (as shown in Table 3), it is clear that the distributions relative to the normal, become more peaked and skewed to the right as the holding period is lengthened. And in general, there is a decreasing chance that a negative risk premium will be observed with longer holding periods. In reference to the Table, it is notable that the percentage of negative premiums may be unacceptably high, especially for investments over the short term (5 years or less). For investors who focus on the very short term, it appears that the likelihood of a negative outcome is nontrivial. The big winner in this regard is SmallCap Value in that the percentage of negative outcomes is the smallest for all four groups. It ranges from 29.82% at the 1-year horizon and drops to .97% for the 30-year horizon. That observation, along with a 187.29% mean expectation, makes for a very interesting story for SmallCap Value investors.
Why does it matter?
Although no more alarming than the results for the equity risk premium, the prospect of a nontrivial negative premium is significant at the 1-5, and even 10-year horizons. Professional investors and other practitioners utilizing this data within that time frame to make investment recommendations should be cautious. As the authors put it:
The message from Table 3 is that chance is a big player in outcomes for these horizons.
The most important chart from the paper
The results are hypothetical results and are NOT an indicator of future results and do NOT represent returns that any investor actually attained. Indexes are unmanaged and do not reflect management or trading fees, and one cannot invest directly in an index.
Abstract
The average monthly premium of the Market return over the one month T-bill return is substantial, as are average premiums of value and small stocks over Market. As the return horizon increases, premium distributions become more disperse, but they move to the right (toward higher values) faster than they become more disperse. There is, however, some bad news. Even if future expected premiums match high past averages, high volatility means that for the 3- and 5-year periods commonly used to evaluate asset allocations, the probabilities of negative realized premiums are substantial, and the probabilities are nontrivial for 10- and 20-year periods.
About the Author: Tommi Johnsen, PhD
—
Important Disclosures
For informational and educational purposes only and should not be construed as specific investment, accounting, legal, or tax advice. Certain information is deemed to be reliable, but its accuracy and completeness cannot be guaranteed. Third party information may become outdated or otherwise superseded without notice. Neither the Securities and Exchange Commission (SEC) nor any other federal or state agency has approved, determined the accuracy, or confirmed the adequacy of this article.
The views and opinions expressed herein are those of the author and do not necessarily reflect the views of Alpha Architect, its affiliates or its employees. Our full disclosures are available here. Definitions of common statistics used in our analysis are available here (towards the bottom).
Join thousands of other readers and subscribe to our blog.


