My last article used Warren Buffett’s pre-crisis sale of put options to highlight the risk of getting over our financial skis. In both temperament and negotiation, Warren can outlast most bear markets. Many of us cannot. Proponents of rebalancing should acknowledge the real risk that downturns can continue, and that rebalancing increases the risk of “crying uncle,” giving into the pain and pulling out of the market when expected returns are the highest. To guard against this potential, investors should first and foremost position themselves for financial survival.
This article argues that survival often means keeping rebalancing in check to increase odds of outlasting a protracted or very deep downturn. Modern Portfolio Theory, I argue, doesn’t say much about portfolio rebalancing. Although common sense arguments for rebalancing exist, the historical support isn’t as robust as first appears and if anything favors trend-following strategies.
Rebalancing in Theory
Modern Portfolio Theory initially argued that investors should hold various leveraged or de-leveraged positions in the so-called market portfolio (whatever that means) depending on their risk tolerance. Those investors would hold portfolios along the tangent line known as the capital allocation line. This result was the crux of the Capital Asset Pricing Model (CAPM).
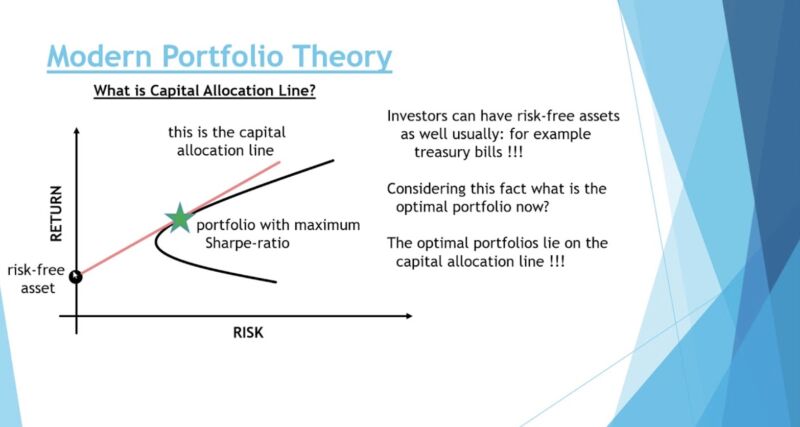
Embedded into that theory was that all investors’ risk that they want compensation for is encompassed in the variance in their portfolio. An investor’s appetite for risk dictated where she was on the capital allocation line, but the average investor held the portfolio with the maximum trade-off between risk and return (i.e., the maximum Sharpe-ratio). The only theoretical reason to rebalance in this world would be if her risk tolerance changed relative to the average investor.(1)
Robert Merton introduced an intertemporal version of CAPM (ICAPM), arguing that investors were really concerned about current and future consumption. Anything that threatened consumption then could also have a risk premium. In an effort to allow various market anomalies, Fama and French (1996) used the ICAPM to show that factors like value and small cap (and eventually quality, operating profitability, investments, and “reluctantly” momentum) may arguably represent risk factors tied to consumption. Various investors’ holdings would reflect how each investor would want to hedge that risk. Again, even with a multi-factor ICAPM model an investor would only adjust her allocation between stocks and bonds (or value, small cap and eventually momentum) based on changes in her tolerance for risk relative to the average investor.
In short, neither expected return model (CAPM or a multi-factor ICAPM) advocate allocating more to stocks just because the market went down. Rebalancing should only occur when an individual’s tolerance for risk changes relative to the average investor. The multi-factor ICAPM conveniently allows for what appears to be behavioral induced market anomalies (gasp, inefficiencies) by declaring them risk factors. Market efficiency remained alive albeit bruised.
Modern Portfolio Theory has continued to evolve. Equity risk premiums, for instance, seem to change which explains why prices are so much more volatile than dividends. As prices drop, equity risk premiums and thus expected returns are more than likely increasing. And prices typically drop heading into a recession when fewer investors can tolerate extra risk, perhaps because they are just scared but perhaps, too, because their jobs (i.e., future consumption) are at risk. If an investor is not scared, worried about their job, or light on other assets, then she should theoretically rebalance by adding equities after a market correction.
Rebalancing in Practice: Evidence and Benchmark drift
Proponents of rebalancing between stocks and bonds on a methodical basis extol the benefits of buying low and selling high. Morgan Stanley, as one example, uses data going back to 1977, to show that rebalancing would have added considerably to historical returns.(2)

This positive result should theoretically come as no surprise. Systematically rebalancing give investors increasingly more exposure to the equity risk premium imbedded in stocks as the market falls. This adds to expected returns, especially because the risk premium likely grows in a bear market. When prices are high, expected returns are lower so selling stocks has less of a detrimental impact.
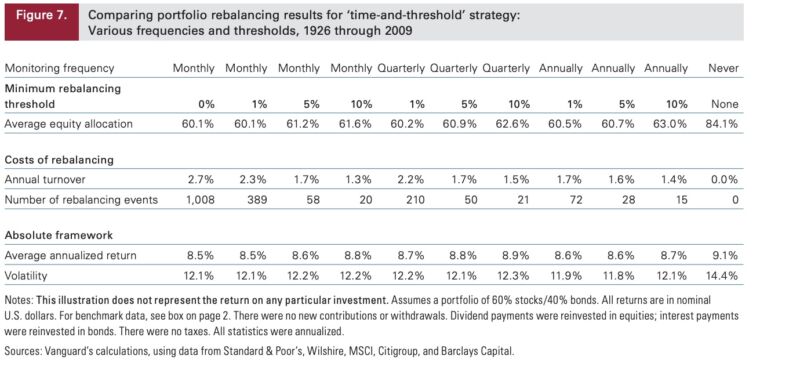
Perhaps more surprising, their results showed that rebalancing also lowered volatility because a portfolio allowed to drift will likely end up overweight in equities. Vanguard did a similar study, but instead of starting in 1977 and ending in 2014 like Morgan Stanley, they started their 60% Equity/40% Bond portfolio in 1927 and ended in 2009. Without rebalancing, an investor would have an average 84.1% allocated to equities. Unlike Morgan Stanley’s results which started with bond yields near 7%, Vanguard’s more equity heavy unbalanced portfolio returns more than the 60%/40% alternatives, but with much more risk.
Start and end dates aren’t the only test’s parameters that can impact the results. Corey Hoffstein and his team at Newfound Research show that the month you rebalance may also matter.(3)
Those in May have a much better overall performance relative to those that rebalance in October. Within any one year, the results can be even more meaningful. Those that rebalanced in February of 2009 had a 7% higher one-year return versus those that rebalanced in August of 2008. Likewise, the 16th and 31st of each month (can you say “paydays”) statistically outperform other days.
Lastly, the “market portfolio” for CAPM and ICAMP doesn’t stay stagnant. For example, there are new bonds issues, stock buybacks and IPOs. Of course, an investor with a 60/40 equity/bond portfolio starting in 1926 with 99% of their portfolio now invested would be awfully rich. Still, as Cliff Asness points out in his article “Why Not 100% Equities”, that same investor could minimize his risk and retain his returns by simply leveraging a constantly rebalanced 60/40 portfolio. Having 99% invested in equities just isn’t optimal and rebalancing made a lot of sense.
The Problem with History
Investors shouldn’t take too much comfort that rebalancing has worked historically, especially if the analysis is focused on U.S. markets (which could be an anomaly). The success of the US market relies, to some degree, on mean reversion in prices. Jerry Siegel, the author of “Stocks for the Long Run” points out, an investor in the past would have performed very well over any long-term period allocating a significant portion of their wealth to equities. But as Fama and French also recently calculated, based on the estimated average monthly equity premium and volatility since 1967, even long-term investors with time horizons of twenty years have an 11% chance they won’t earn anything over treasury bills.
My takeaway? Just because something hasn’t happened doesn’t mean it can’t.
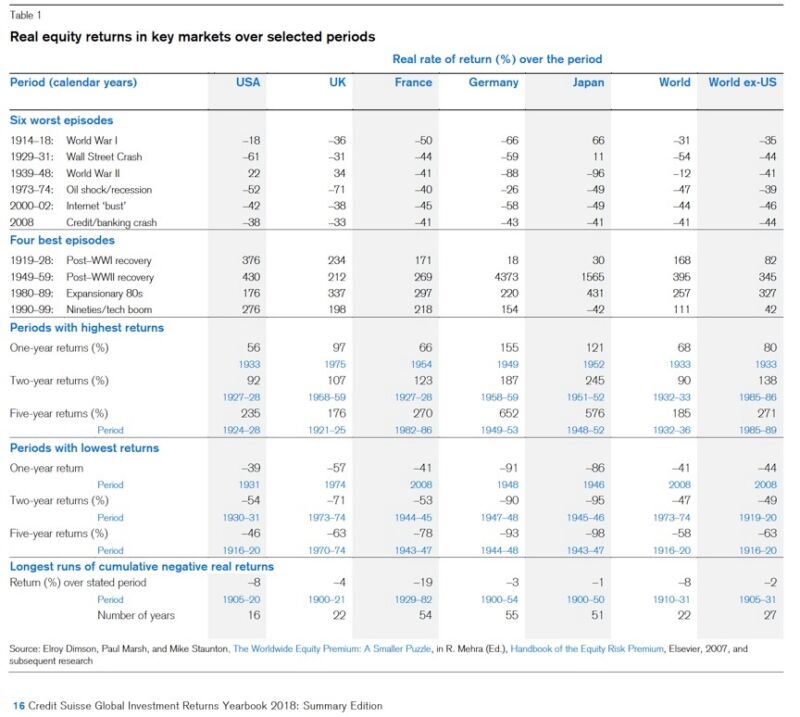
Any historical test of a mean reversion strategy, including rebalancing, is rigged when the average is already known. Of course, rebalancing strategies will work because the stock market has always gone up after it has gone down. Based on this observation, many Japanese investors were convinced that over the long-run, their domestic stock market would outperform bonds. Those Japanese making that bet in 1989 are still waiting for the rebound. In fact, as Credit Suisse’s Global Investment Returns Yearbook 2018 highlights, when looked at over many countries and many decades, the average investor would have failed to outlive the rebound in multiple countries. Note, too, that the table below doesn’t include pre-communist China or Imperial Russia where investors were wiped out. Global diversification reduces the impact of these single country events, but the global equity risk premium appears to Credit Suisse to be only moderate 4.5% versus cash and could be (and arguably likely is) even lower going forward.
The Most Important Goal: Survival
History is a guide, but it’s not a map. Investors still need to make sure their road doesn’t end. It eventually worked out for Warren when he sold his put options, and kudos to those that rebalanced at the end of 2008. But those who pulled out early also survived and many (and most trend-followers) had enough dry powder to get back into the market.
Mere mortals that are committed to rebalancing in a falling market are using borrowed funds, not so much from a bank but rather from their own stash of safe assets. That leverage is hardly risk-free. Should the market keep falling and the rebalancing investor keep buying, an investor simultaneously increases her risk of insolvency or simple intolerance for further risk (or perhaps her spouse’s tolerance for risk).
Surviving as a goal isn’t a new insight. Nassim Nicholas Taleb, in his new book “Skin in the Game” attributes the quote “in order to succeed, you must first survive” to Warren Buffett. He argues (and argues) that avoiding the “uncle point” (i.e., where you have to cry uncle to stop) is paramount to successful risk taking. Warren Buffett, in his 2012 article to shareholders, also expanded on the risk aversion of running out of safe assets:
Charlie and I believe in operating with many redundant layers of liquidity, and we avoid any sort of obligation that could drain our cash in a material way. That reduces our returns in 99 years out of 100. But we will survive in the 100th while many others fail. And we will sleep well in all 100.
Cliff Asness in his article The 5 Percent Solution also argues to avoid the situation where you are forced to sell, but concedes that the resolve to never cry uncle is easier to say than implement in the face of what appears to be a market meltdown. Given that reality, he also makes a case for systematic drawdown limits. As highlighted often on this blog (see here and here), trend-followers do just that by eliminating extreme tails and have an impressive track record across markets, asset classes and time. Yes, risk premiums increase as markets go down (and fear goes up), but this fear seems to also feed off itself. As more people are scared, the more other people get scared. The slowness of investors to adjust is also the result of anchoring, a classic and well documented cognitive bias tied to using the most recent past experience as their reference point.
Anchoring the success of rebalancing of the recent past, investors learn to buy the dips. After all, buying the dip worked when it seemed inevitable that Greece would leave the European Zone in 2011, again when China looked like it would implode in early 2016, with Brexit in June of 2016 and most recently in December of 2018 when an aggressive Fed and trade rhetoric seemed to be pushing us to a recession. Trend-following performance has had a tough run while buying the dip investors are currently smug.
I was one of those smug investors buying the dip immediately following the market plunge immediately following the collapse of Lehman Brothers in September of 2008. Surely the panic was at its highest, I reasoned, and my expected return was high. No and yes. Panic seldom appears unprovoked. The ensuring collapse of the commercial paper market and run on the banks nearly led to a true economic apocalypse. Just because expected returns are high doesn’t mean it will be realized anytime soon. The return of the market is expected, not guaranteed.
History has also taught us to hold on and even rebalance. But rebalancing works until it doesn’t. Trend-following teaches that investors haven’t historically discounted probabilities of calamity very well. Modern Portfolio Theory argues that at the margin, we should only react after we weigh our tolerance for risk against others. Common sense tells us that above all else, stay alive.
Conclusion
Selling puts eventually worked out for Warren as did rebalancing at the end of 2008 and at the end of this year. But mimicking that behavior shouldn’t be the lesson learned. A young investor, whose human capital (their own capacity to earn money) is the bulk of her wealth, can withstand a steep drawdown. This investor may want to rebalance and invest when things look their worst. She can also incorporate a trend-following approach as a potentially lucrative alternative if she realizes the potential costs of getting whipsawed. However, for a recently retired — or near-retired investor — with limited assets, rebalancing should be undertaken cautiously, if at all.
Being forced to sell to protect a diminished nest egg locks in the losses and leaves little to get back in the market. Buying more and more stock as the market goes down accelerates that race to that breaking point. By limiting losses before the uncle point arrives, a trend-following approach can act as insurance. Although historically that insurance has saved investors’ money (as opposed to the historical track record of buying put options), going forward the benefit, if any, is less clear.
Then again, failure of the house burning down doesn’t mean the cost of fire insurance is unreasonable.
References[+]
| ↑1 | Merton, R.C., (1973), An Intertemporal Capital Asset Pricing Model. Econometrica 41, Vol. 41, No. 5. (Sep., 1973), pp. 867–887 |
|---|---|
| ↑2 | Andrew Miller argues that we should actually pay more attention to momentum! |
| ↑3 | Hoffstein, Corey and Sibears, Justin and Faber, Nathan, Rebalance Timing Luck: The Difference Between Hired and Fired (October 2018). Available at SSRN: https://ssrn.com/abstract=331904. |
About the Author: Jonathan Seed
—
Important Disclosures
For informational and educational purposes only and should not be construed as specific investment, accounting, legal, or tax advice. Certain information is deemed to be reliable, but its accuracy and completeness cannot be guaranteed. Third party information may become outdated or otherwise superseded without notice. Neither the Securities and Exchange Commission (SEC) nor any other federal or state agency has approved, determined the accuracy, or confirmed the adequacy of this article.
The views and opinions expressed herein are those of the author and do not necessarily reflect the views of Alpha Architect, its affiliates or its employees. Our full disclosures are available here. Definitions of common statistics used in our analysis are available here (towards the bottom).
Join thousands of other readers and subscribe to our blog.