Research demonstrates that the investment factor has explanatory power for the cross-section of stock returns, with high-investment firms tending to underperform low-investment firms. For example, Kewei Hou, Chen Xue and Lu Zhang, authors of the 2015 paper “Digesting Anomalies: An Investment Approach,” proposed replacing the Fama-French three-factor (market beta, size and value) model with a four-factor model that went a long way toward accounting for many of the anomalies that neither the Fama-French three-factor model nor the Carhart four-factor model (which added momentum as the fourth factor) could explain.
In their model, which Hou, Xue and Zhang call the “q-factor model,” an asset’s expected return in excess of the riskless rate is described by the sensitivity of its return to the returns of four factors: market beta, size, investment (the difference between the return on a portfolio of low-investment stocks and the return on a portfolio of high-investment stocks, or CMA, conservative minus aggressive) and profitability (the difference between the return on a portfolio of high return-on-equity stocks and the return on a portfolio of low return-on-equity stocks, or RMW, robust minus weak).
Eugene Fama and Kenneth French, in their paper “A Five-Factor Asset Pricing Model,” examined the q-factor model and agreed that a four-factor model that excludes the value factor (HML, or high minus low) captures average returns as well as any other four-factor model they considered, and that a five-factor model (adding HML) doesn’t improve the description of average returns over that of the four-factor models. This occurs because the average HML return is captured by HML’s exposure to other factors. Thus, in the five-factor model, HML is redundant for explaining average returns. (see here for an extensive discussion on the factor model debates).
Explanations for the Investment Premium
As with the value premium, there’s a debate about whether the investment factor has a risk-based or behavioral-based explanation. Rational theories suggest that the investment premium reflects firms’ investment decisions—firms invest when they have low leverage and expected stock returns are low (the discount rate is low, making the net present value of the investment higher), whereas firms do not invest when they have high leverage and expected stock returns are high.
Behavioral theories argue that the investment premium reflects mispricing, as investors do not properly incorporate information on firms’ investment decisions into asset prices. In his November 2018 paper, “Does Debt Explain the Investment Premium?”, Thomas Poulsen writes:
Investors extrapolate past performance too far into the future when they value stocks. If firms with high asset growth performed well in the past, investors expect them to continue to do so in the future. Investors overvalue stocks in these firms to the extent that they cannot live up to the high growth expectations going forward. When realized asset growth falls short of expectations, the market corrects the initial overvaluation and these stocks have low returns.
Alternatively, investors fail to recognize that high asset growth may reflect overinvestment. The result is, according to Poulsen, that “investors tend to overvalue firms with high asset growth. The subsequent low stock returns to high asset-growth firms reflect that the market corrects the initial over-valuation.”
Evidence from the Bond Market
Benedikt Franke, Sebastian Müller and Sonja Müller contributed to the literature on the investment factor with their study “The Q-Factors and Expected Bond Returns,” published in the October 2017 issue of the Journal of Banking & Finance. They used a sample of U.S. corporate bonds from 1995 to 2011 to examine how exposure to the q-factor is priced by corporate bond investors. They found that there is not a robust relationship between exposure to the investment factor and the cost of debt. This held true regardless of the state of the economy. The conclusion that can be drawn is that, at least in terms of corporate debt, the investment factor is not a risk factor—it’s a behavioral one. This seems more likely than the other possible conclusion, which is that the institutional investors who dominate the corporate bond market are making persistent pricing mistakes that go uncorrected.
Does Debt Explain the Investment Premium?
Poulsen provides the latest contribution to the literature in his November 2018 paper. His data sample covers the period from July 1970 through June 2016, and almost 15,000 firms.
The following is a summary of his findings:
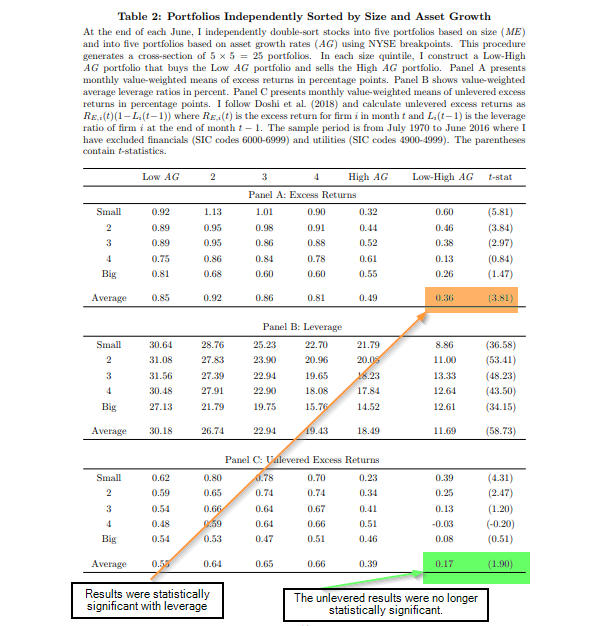
- The investment premium decreases from 0.36 percent per month (statistically significant at the 1 percent confidence level with a t-stat of 3.8) with levered returns to 0.17 percent per month (and fell short of conventional statistical significance with a t-stat of 1.90) once leveraged is controlled for.

The results are hypothetical results and are NOT an indicator of future results and do NOT represent returns that any investor actually attained. Indexes are unmanaged and do not reflect management or trading fees, and one cannot invest directly in an index.
- The investment premium decreases from 0.36 percent per month (statistically significant at the 1 percent confidence level with a t-stat of 3.8) with levered returns to 0.17 percent per month (and fell short of conventional statistical significance with a t-stat of 1.90) once leveraged is controlled for.

- There is a strong relationship between asset growth and leverage. Within each size quintile, the average leverage ratio decreases monotonically with asset growth. The differences between average leverage ratios in the low and high asset-growth portfolios are highly statistically significant—firms’ investment and financing decisions are related. Because behavioral theories do not distinguish between zero-leverage and levered firms, this finding is inconsistent with behavioral explanations.
- The investment premium increases with firms’ refinancing intensities. Measuring refinancing intensity by the ratio of debt maturing within one year to total debt, the return differential increases monotonically from 0.12 percent per month for firms with low refinancing intensities to 0.64 percent for firms with high refinancing intensities—the difference is statistically significant (t-stat = 2.6) and remains almost the same measured in risk-adjusted returns when controlled for exposures to common risk factors (market, size, value, momentum, profitability and even investment).
- When leverage is controlled for, the unlevered return differential between low and high asset-growth firms increases with refinancing intensities by 0.33 percent. Leverage therefore explains some of the cross-sectional return differential, although refinancing intensities remain informative about the investment premium. Rational financial theory suggests that both the riskiness of debt and the expected stock return increase with leverage and its intensity.
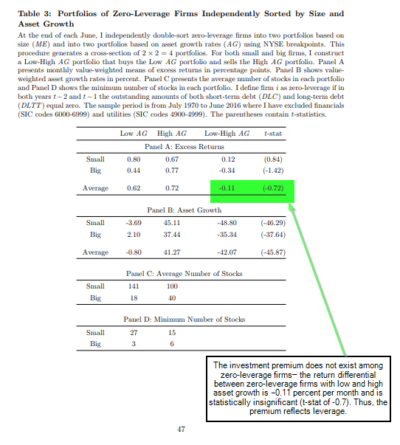
Poulsen found that his results are “inconsistent with prominent theories using firms’ investment decisions to explain the investment premium”—otherwise, there would be an investment premium in the stocks of low investment firms without debt. He added: “The investment premium reflects both leverage and refinancing intensities [reflecting rollover risk]. These two factors explain 36% of the time-series variation in the investment factor.”
Poulsen added that rational financial theory suggests that both the riskiness of debt and the expected stock return increase with leverage and its intensity. The model predicts that firms with low asset growth will have higher leverage and higher expected stock returns relative to firms with high asset growth, which the author writes are consistent with his empirical findings.
Poulsen concluded:
Taken together, my results offer a novel perspective on the economic interpretation of the investment premium and shed new light on the asset pricing implications of firms’ investment and financing decisions. I focus on the effects of leverage and refinancing intensities but the investment premium may also be related to other financing decisions such as the choice of debt covenants.
Summarizing, Poulsen’s findings provide valuable insights into how the investment premium adds explanatory power to the cross-section of expected returns—the investment premium is related to leverage and refinancing intensity (two risk factors) and is not present in zero leverage firms.
About the Author: Larry Swedroe
—
Important Disclosures
For informational and educational purposes only and should not be construed as specific investment, accounting, legal, or tax advice. Certain information is deemed to be reliable, but its accuracy and completeness cannot be guaranteed. Third party information may become outdated or otherwise superseded without notice. Neither the Securities and Exchange Commission (SEC) nor any other federal or state agency has approved, determined the accuracy, or confirmed the adequacy of this article.
The views and opinions expressed herein are those of the author and do not necessarily reflect the views of Alpha Architect, its affiliates or its employees. Our full disclosures are available here. Definitions of common statistics used in our analysis are available here (towards the bottom).
Join thousands of other readers and subscribe to our blog.

