Reconsidering Returns
- Samuel M Hartzmark, David H. Solomon
- A version of this paper can be found here
- Want to read our summaries of academic finance papers? Check out our Academic Research Insight category.
What are the Research Questions?
The easiest question in finance is, “what did the market do yesterday?” Even if you didn’t happen to memorize the return of the S&P from the previous day a quick google search will reveal the answer in moments. Or will it? This paper looks into the claim that market returns represented daily in the financial press accurately represent the true total return investors realized. As non-computer humans whose perceptions of performance can be easily biased it ought to be imperative that we get the clearest return data we can. Unfortunately the bulk of, if not all, sources for return data rely 100% on previous day’s price-performance completely ignoring the return driven by dividends. We’ve previously taken a dive into dividends here, Jack covered another paper by Sam and David titled “The Dividend Disconnect,” and we’ve looked into the value of Shareholder Yield here.
- How are returns reported across the data provider landscape?
- What are the impacts as a result of price data being the only return component that is reported?
What are the Academic Insights?
Market and stock returns are routinely reported with price return data as the only return for investors, but this ignores a significant additional source of return for investors, dividends. The authors argue that the reporting of only price return data, and ignoring total return(1) information creates unintended consequences and has effects that reverberate through the market.
- Market and stock returns are routinely reported with price return data as the only source of return for investors. The research team examined statements from 6 different brokerage houses. Of the six, only one displayed total return data(2). In addition to brokerages, the team analyzed 9 financial websites. Here they found that none of them reported total return data, and amazingly, 2 of them showed no dividend information at all.
- The impacts of the return data discrepancy reverberate through the markets. The research team found the following:
- Conditional on the return of the prior day, high dividend yields are associated with a more pessimistic tone in the press. Showing that reporters neglect the dividend component of market returns.
- Even after applying controls, beating the S&P500 Price index in NAV terms still, has a large effect on future fund flows(3)
- The research team suggests that investors ought to only care about the total excess market return, and thus beta’s on price return and dividend return should be the same. Yet the team observed a unusual difference between betas on price changes and the beta on dividends, with the response to dividends being much less than for price changes. This suggests that investors pay much more attention to price returns than they do to dividend or total returns.
- Consistent with a low beta on dividends, the markets under-react to returns made up by the dividend yield.
Why does it matter?
As this paper has shown, the misrepresentation of returns has effects that reverberate throughout the financial markets from mutual fund selection to newspaper pessimism. Daniel Kahneman and Amos Tversky have made it apparent that bias can easily creep into our everyday lives, one simple way to implement bias in a system is by the misrepresentation of data. By reporting only price return data, the market unnecessarily creates an opportunity for bias to wiggle its way into the investor’s decision-making process.
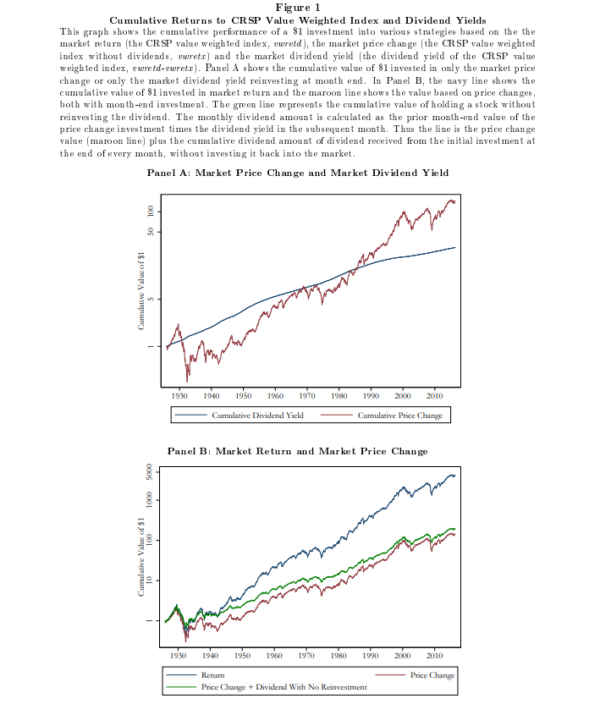
What is the most important chart from the paper?

Abstract
Investors’ perception of performance is biased because the relevant measure, returns, is rarely displayed. Major indices ignore dividends, inducing mechanical under performance on ex-dividend days. Newspapers are more pessimistic on these days, consistent with mistaking the index for a return. Market betas should track returns, but track prices more than dividends, creating predictable market returns. Mutual funds receive inflows for “beating the S&P 500,” comparing the price-only index with the fund’s net asset value change (also not a return). Displaying returns by default would ameliorate these issues, which arise despite high attention and little ambiguity regarding the appropriate measure. https://papers.ssrn.com/sol3/papers.cfm?abstract_id=3039507
References[+]
| ↑1 | price return and dividend return combined equal Total return |
|---|---|
| ↑2 | Interactive Brokers was the one brokerage firm that displayed total return data. In fact, it uses this as a differentiating characteristic to separate it from competitors in some marketing material. |
| ↑3 | Note that beating the PRICE INDEX on NAV terms is arguably the least economically rational method of measuring performance. |
About the Author: Rich Shaner, CFA
—
Important Disclosures
For informational and educational purposes only and should not be construed as specific investment, accounting, legal, or tax advice. Certain information is deemed to be reliable, but its accuracy and completeness cannot be guaranteed. Third party information may become outdated or otherwise superseded without notice. Neither the Securities and Exchange Commission (SEC) nor any other federal or state agency has approved, determined the accuracy, or confirmed the adequacy of this article.
The views and opinions expressed herein are those of the author and do not necessarily reflect the views of Alpha Architect, its affiliates or its employees. Our full disclosures are available here. Definitions of common statistics used in our analysis are available here (towards the bottom).
Join thousands of other readers and subscribe to our blog.

