Cash Flow Duration and the Term Structure of Equity Returns
- Michael Weber
- A version of the paper can be found here.
- Want to read our summaries of academic finance papers? Check out our Academic Research Insight category.
What are the research questions?
Some background on Bond duration: Duration measures bond’s price sensitivity to interest rates changes. It’s estimated based on the discounted expectations of the bond future cash flows and expressed in the number of years. The longer the duration, the higher the bond interest rate risk. (read more: Bond Performance when Interest Rates Spike)
Dechow, Sloan, and Soliman (2004) employs this duration techniques to evaluate equity risks. Following the traditional Macaulay duration, they construct a discounted cash flow forecasting model for stocks as well. Contrary to bonds, stocks do not have a well-defined finite maturity and cash flows are not that predictable. So their formula is built with a finite forecasting period and an infinite terminal value. Their study finds that similar to bonds, stocks with higher cash-flow duration are associated with high return volatilities and betas (i.e., higher risks.)
This recent research by Dr. Weber re-examines the term structure of equity returns. With the primary question being:
- Does stock cash flow duration impact returns?
- What could be causing the mispricing of long duration stocks?
What are the Academic Insights?
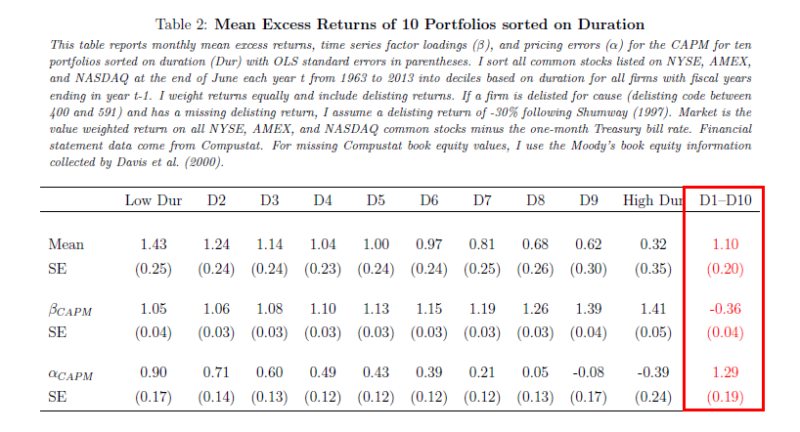
At the end of June each year t from 1963 to 2013, Weber sorts stocks into 10 portfolios based on cash-flow duration and rebalances the equal-weighted portfolio on an annual basis.
- YES. A L/S strategy longing low-duration stocks (D1) and shorting high-duration stocks (D10) generates a statistically significant monthly alpha of 1.29%. See the table below.
So now that we’ve recognized that there is variation between low duration and high duration returns we should explore the second main question of this paper, WHY?
Upon further tests, the authors prove that existing risk factors cannot sufficiently explain this low-duration premium. What’s more, the premiums are stronger following periods of high investor sentiment, which indicates that human behavioral might be an explanation.
Weber hypothesizes that analysts tend to extrapolate from past earnings growth into the future. 5 words can explain this premium: Temporary Overpricing of High-duration Stocks.
To test his hypothesis, Weber studies the analyst’s earnings expectations of each of the 10 groups. The table below shows the evolution of the average portfolio long-term earnings growth (LTG) forecast from year 1 to year 5.
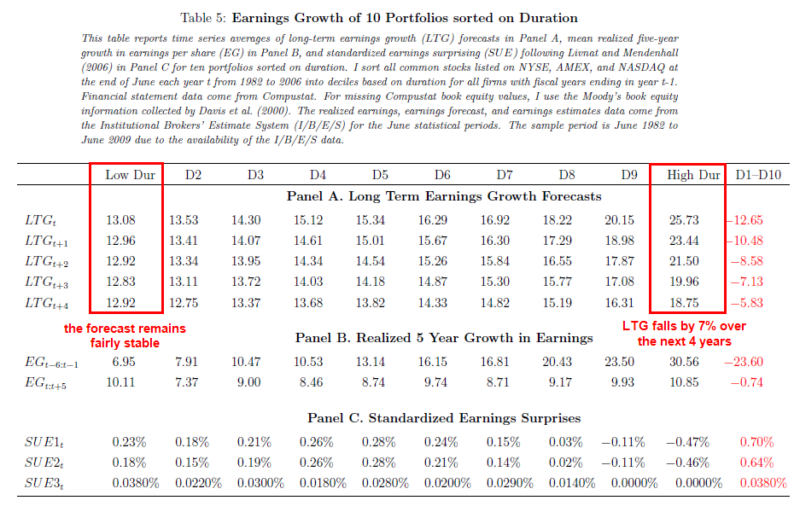
Key points: it’s about “Extrapolation Bias”…
- Panel A: In year 1, high-duration stocks enjoy higher analyst’s earnings expectations. From year 2-5, the analyst’s earnings forecast remains fairly stable for low-duration stocks. However, long-term earnings growth (LTG) falls by 7% for high-duration stocks.
- Panel B shows the realized 5-year growth in earnings. In year 1, high-duration stocks show much higher realized growth in earnings but the difference in growth rates disappears over the following five years.
- Panel C shows that high-duration stocks have negative earnings surprises.
2. All the results show that analysts have overly optimistic earnings expectations for high-duration stocks, but they adjust downwards over time.
Why does it matter?
Duration has been a key characteristic in the analysis of the bond market for a long time, maybe forever, but it’s a tool that has not been traditionally used by equity investors. This paper has pointed out that although it may be challenging to implement this to realize profits that doesn’t mean that being aware of cash flow durations in equities is a useless metric.(1)
Abstract
The term structure of equity returns is downward-sloping: stocks with high cash flow duration earn 1.10% per month lower returns than short-duration stocks in the cross section. I create a measure of cash flow duration at the firm level using balance sheet data to show this novel fact. Factor models can explain only 50% of the return differential, and the difference in returns is three times larger after periods of high investor sentiment. Analysts extrapolate from past earnings growth into the future and predict high returns for high-duration stocks following high-sentiment periods, contrary to ex-post realizations. I use institutional ownership as a proxy for short-sale constraints, and find the negative cross-sectional relationship between cash flow duration and returns is only contained within short-sale constrained stocks.

References[+]
| ↑1 | So if the trading profit opportunities exist, why isn’t everyone doing this? Weber says that the premiums are mainly attributable to the short leg. But in the real world, short-sale constraints are preventing smart arbitrageurs from correcting the mispricing. He uses institutional ownership as a proxy for short-sale constraints and then demonstrates his hypothesis. |
|---|
About the Author: Wesley Gray, PhD
—
Important Disclosures
For informational and educational purposes only and should not be construed as specific investment, accounting, legal, or tax advice. Certain information is deemed to be reliable, but its accuracy and completeness cannot be guaranteed. Third party information may become outdated or otherwise superseded without notice. Neither the Securities and Exchange Commission (SEC) nor any other federal or state agency has approved, determined the accuracy, or confirmed the adequacy of this article.
The views and opinions expressed herein are those of the author and do not necessarily reflect the views of Alpha Architect, its affiliates or its employees. Our full disclosures are available here. Definitions of common statistics used in our analysis are available here (towards the bottom).
Join thousands of other readers and subscribe to our blog.