The grand experiment of combining massive fiscal and monetary stimulus at a time when the economy is already recovering strongly—the Fed’s latest forecast for 2021 GNP growth is 6.5 percent—has led many investors to begin to worry about the risks of rising inflation. And strong growth is expected to continue well into next year. For example, the Philadelphia Federal Reserve First Quarter 2021 Survey of Professional Forecasters predicts real GNP growth in 2022, 2023, and 2024 of 4.8 percent, 4.2 percent, and 4.0 percent, respectively. The heightened concerns contrast with the market’s forecast of a moderate rise in inflation—as of April 6, 2021, the spread between the yield on 10-year nominal Treasuries (1.66 percent) and 10-year TIPS (-0.66) was just 2.32 percentage points.
As another indicator of inflation expectations, the First Quarter 2021 Survey of Professional Forecasters for inflation over the next 10 years is also just 2.2 percent. With that said, many economists are worried that the dual stimulus could lead to a repeat of the problem the economy faced in the similar but much smaller stimulus during the late 1960s through the late 1970s—from 1958 through 1965, inflation averaged just 1.4 percent and never exceeded 1.9 percent, but from 1966 through 1981, inflation averaged 7 percent and peaked at 13.3 percent in 1979. For example, in late March Larry Summers, Secretary of the Treasury under President Clinton, warned of the risks of inflation, stating, “The U.S. is suffering from the least responsible macroeconomic policy in four decades.”
While there are no clear crystal balls that allow us to see what future inflation will be, investors should at least incorporate the risk that it could increase significantly. That raises the question of how investors can prepare for that risk. With fixed-income assets, the answer is relatively simple—prefer TIPS over nominal bonds and avoid longer-term nominal bonds. That doesn’t mean keeping all maturities at the very short end of the curve because the market is already incorporating the likelihood of higher rates into current yields. In fact, on April 6 the yield curve was relatively steep, with the spread between two- and 10-year Treasuries at about 1.5 percentage points (0.16 vs 1.67). That spread was under 0.5 percentage point last August. Staying short not only runs reinvestment risk but also sacrifices what has historically been a significant term premium. Thus, I would recommend keeping averaging maturities in about the four- to five-year range, balancing the twin risks of inflation and reinvestment risk—which brings us to the question of what to do with equity risks.
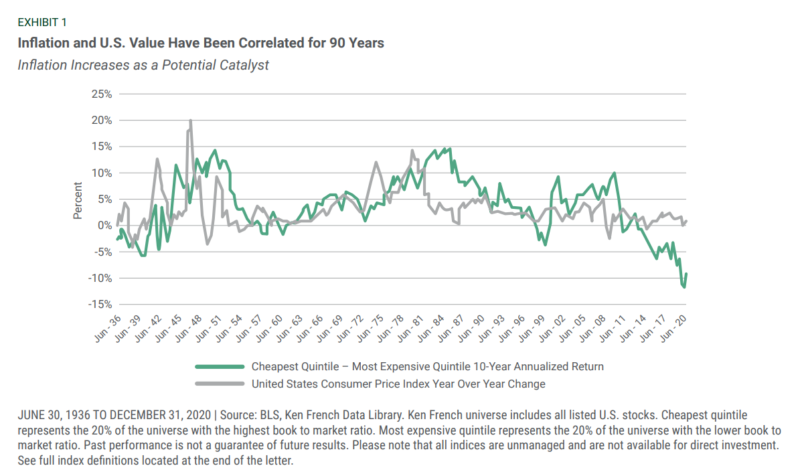
Rising inflation, which would lead to rising interest rates, would not only lead to increased risks for fixed income assets but might also lead to risks to the broader equity market as the increased discount rates applied to future expected earnings decrease present values. Another explanation often cited is that periods of low/negative inflation are typically associated with weak economic growth. When economic growth is weak, investors tend to be more willing to “pay up” for growth when it is scarce. Hence, growth stocks tend to perform relatively better as their relative valuations increase. The reverse is true in stronger economies when growth is more plentiful. And higher inflation is often associated with stronger economic growth. Andrew Berkin, who has co-authored two books with me, wrote a nice piece on these issues, which can be found here. To test the hypothesis about the correlation of the value premium and inflation, I examined how the value premium performed during various inflation regimes.
Historical Evidence
From 1927 through 2020, the annual value premium (Fama-French HML) was 4.0 percent, and its annual correlation with inflation (as measured by the Bureau of Labor Statistics CPI) was 0.13. The positive correlation provides support to the hypothesis that in an inflationary environment, value stocks should be expected to outperform growth stocks on average. Looking at individual years, it is clear that the risk of value stocks shows up in deflationary times. Over this period there were eight years when the CPI fell. The average value premium during those years was -2.0 percent. In addition, in only two of those years was the value premium positive (1932 and 1954). In three of the eight years, the value premium was -12.2 percent or worse. Worth noting is that in 1954 the CPI was barely negative at -0.7 percent, and the value premium was 26.2 percent. If we exclude that year (the years when deflation was at least -1 percent), the value premium was -6 percent.
We will now examine the value premium during various inflationary regimes:
- When inflation was between 0 and 3 percent, the value premium was 3.1 percent.
- When inflation was greater than 3 percent, the value premium was 6.6 percent. When it was below 3 percent, it was 2.4 percent.
- When inflation was greater than 4 percent, the value premium was 6.2 percent. When it was below 4 percent, it was 3.2 percent.
There is one other interesting data point. The U.S. has experienced only one extended period of high inflation. After inflation averaged just 1.6 percent from 1952 through 1967, from 1968 (inflation first rose above 4 percent) through 1981 (inflation fell below 4 percent in 1982) inflation averaged 7.6 percent. Over this 14-year period, the S&P 500 Index returned 6.0 percent per annum (cumulative total return of 126 percent) and the Fama-French U.S. Growth Research Index returned 4.8 percent (cumulative total return of 93 percent). Both underperformed riskless one-month Treasury bills, which returned 7.2 percent (total cumulative return of 164 percent). And the Fama-French U.S. Value Research Index returned 12.6 percent (total return of 424 percent). In terms of cumulative total returns, the value research index outperformed the S&P 500 Index by 298 percentage points and the growth research index by a cumulative 331 percentage points.
The evidence supports the hypothesis that value stocks are likely to outperform growth stocks during periods of higher/rising inflation. However, it is also important to understand that the relationship is not entirely linear. The reason is that if inflation rises to 1970s levels, it is likely the Federal Reserve would tighten monetary policy sufficiently to restore price stability. A sufficiently tight monetary policy would raise real interest rates to high levels, leading to a recession, which is when the economic cycle risks of value stocks tend to appear. Again, the market is forecasting that the Federal Reserve has learned from the mistakes it made in the 1960s and 70s and will act well before inflation becomes a serious threat, avoiding the need to drive real interest rates to levels that would cause a recession. Another reason why the relationship between the value premium and inflation might not be linear is that relative valuations can get “stretched,” as they did in the late 1990s when growth stocks became the most expensive they had ever been relative to value stocks.
Further Evidence
The research team at the investment management firm Brandes Investment Partners examined the evidence on the relationship between the global value premium and inflation over the period 1985 through 2019. They found that during periods of rising inflation, the global value premium was 2.2 percent compared to -2.1 percent when inflation was falling. In addition, during periods of rising or above-average inflation, the global value premium was 1.9 percent. But during periods of falling and below-average inflation, the global value premium was -5.7 percent.
They also examined the relationship between the performance of the Russell 1000 Value and the Russell 1000 Growth Indices and inflation over the period 1979 through 2019. They found that over this time during periods of above-average inflation, the Russell 1000 Value Index outperformed by 2.7 percent. In contrast, during periods of below-average inflation, it underperformed by 3.2 percent. During periods of either above-average or rising inflation, the Russell 1000 Value Index outperformed by 0.9 percent, while during periods of below-average and falling inflation, it underperformed by 3.2 percent.
Brandes offered the following explanations for the relationships it found:
- Financials: Financial firms are the largest component of many value indices and generally benefit from a higher and more upwardly sloping yield curve because they are able to borrow short duration (deposits) and lend longer duration, potentially boosting the spread between the rates they pay on their liabilities (deposits) and the rates they earn on their assets, and higher rates have the potential to benefit their shorter-term investments.
- Cyclical stocks: Value stocks in general (including financials but also industrials, energy, etc.) tend to be economically sensitive. A rising rate environment has tended to correlate with a strengthening economy, which in turn has historically been good for the economically sensitive value stocks.
- Sentiment: Based on our observations, during times of significant economic uncertainty, such as those experienced during a trade war and a pandemic, investors are willing to pay a premium for the visibility/prospects provided by growth stocks, which tend to be less economically sensitive than value stocks. As the economy strengthens (and inflation rises), investors typically become more comfortable buying economically sensitive value stocks as their prospects improve.
- Discount Rate: Rising interest rates typically increase the discount rate with which long-duration growth stocks are valued. A higher discount rate used in calculating the present value of distant cash flows for growth companies means those cash flows are worth incrementally less compared to value stocks’ more immediate cash flows.
Investor Takeaways
After a long and difficult period (October 2016 through March 2020) for value investing, the overall economic environment (stronger economy and the Federal Reserve striving to increase inflation, even allowing it to temporarily rise above its long-term target of 2 percent) seems to favor value. Thus, if you are concerned about the risks of the potential for rising inflation, one way to address that risk would be to consider adding more exposure to value stocks.
The past year has seen returns for value stocks dramatically outpace returns for growth stocks as interest rates have climbed, the economy has begun to recover, and expected inflation has increased (the spread between 10-year nominal Treasuries and 10-Year TIPS widened). While your portfolio allocation should not rely on your opinions (or anyone else’s, as there are no good forecasters) of interest rates or inflation, the current environment does appear to bode well for value stocks given their historical correlations with inflation and interest rates. In addition, even after their outperformance over the past year, value stocks continue to trade at historically high discounts compared to growth stocks.
With that said, investors should always think of forecasts in terms of possible dispersion of outcomes. For example, while it is certainly possible that all of the fiscal and monetary stimulus could lead to a period of significant increases in inflation, it’s also possible that the Federal Reserve will be able to prevent inflation from increasing much above current levels. In fact, that is what the current yield is telling us the market expects. Investors should also consider a third possibility: the massive increase in debt will cause a deflationary problem, as has occurred in Japan. That is why your investment plan should be designed to be able to survive under various economic conditions.
The information presented herein is for educational purposes only and should not be construed as specific investment, accounting, legal, or tax advice. Certain information contained may be based on third party data which may become outdated or otherwise superseded without notice. Third party information is deemed to be reliable, but its accuracy and completeness cannot be guaranteed. By clicking on any of the links above you acknowledge that they are solely at your convenience, and do not necessarily imply any affiliations, sponsorships, endorsements or representations whatsoever by Buckingham regarding third-party websites. Buckingham is not responsible for the content, availability, or privacy policies of these sites, and shall not be responsible or liable for any information opinions, advice, products or services available through them. The opinions expressed by the featured author are their own and may not accurately reflect those of Buckingham Strategic Wealth® or Buckingham Strategic Partners® (collectively Buckingham Wealth Partners, “Buckingham”). LSR-21-59
About the Author: Larry Swedroe
—
Important Disclosures
For informational and educational purposes only and should not be construed as specific investment, accounting, legal, or tax advice. Certain information is deemed to be reliable, but its accuracy and completeness cannot be guaranteed. Third party information may become outdated or otherwise superseded without notice. Neither the Securities and Exchange Commission (SEC) nor any other federal or state agency has approved, determined the accuracy, or confirmed the adequacy of this article.
The views and opinions expressed herein are those of the author and do not necessarily reflect the views of Alpha Architect, its affiliates or its employees. Our full disclosures are available here. Definitions of common statistics used in our analysis are available here (towards the bottom).
Join thousands of other readers and subscribe to our blog.