The Role of Cryptocurrencies in Investor Portfolios
- Megan Czasonis, Mark Kritzman, Baykan Pamir, and David Turkington
- MIT Sloan School Working Paper 6418-21
- A version of this paper can be found here
- Want to read our summaries of academic finance papers? Check out our Academic Research Insight category
What are the research questions?
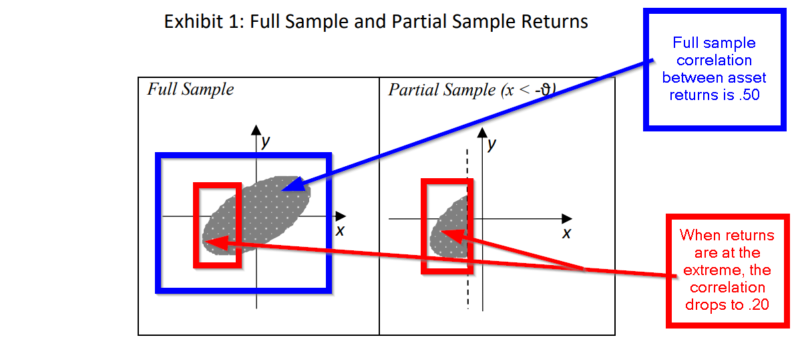
Portfolio diversification benefits are often driven by correlation coefficients, but this analysis can get complicated, fast. Over time academics and practitioners have realized that it is not enough to simply calculate a correlation using short return intervals (daily?, monthly?) over a sample period (3 years?, 5 years?) and combine asset classes together based on the resulting correlation matrix. Many believe that low correlation asset classes are good diversifiers and high correlation asset classes, well…not so much. Unfortunately, these generalizations do not necessarily pan out in reality. For example, over a short horizon, the full sample estimation method often overstates the potential for diversification for an asset when the portfolio is producing negative returns, which is just when diversification is needed the most.
The premise of this research reflects the proposition that the behavior of full sample correlations makes them unsuitable for estimating the diversification potential between asset classes. Full sample correlations by design do not distinguish between upside and downside correlations, the impact of extreme observations on the magnitude of the calculation (see graph below), or the instability of the correlation over time. The authors argue and present evidence that the estimates of correlation of monthly, annual, and 3-year returns mischaracterize the degree of diversification potential present between any 2 asset classes
To address these issues, the authors develop the single period correlation as an alternative to the standard Pearson correlation coefficient as a solution to the myriad of problems presented by full sample methods. The measure derived in the paper is essentially the weighted average of the single period correlations calculated throughout the sample. As such, it captures the trend and time-varying nature of asset class returns. Keep in mind the standard Pearson correlation is the average of the single period correlation across the full sample. When compared to independent calculations using one or three-year returns in a full sample approach, the single period approach is better suited to capturing the time-varying nature of correlations in asset returns. Using this measure the authors address the following questions:
- Is there diversification potential in cryptocurrencies for short term investment horizons?
- Is there diversification potential in cryptocurrencies for long term investment horizons?
- Is there an optimal allocation to cryptocurrencies?
One caveat straight from the authors:
“Our analysis is based on a single pass through history; therefore, one should not draw immutable conclusions from it. Instead, we suggest that investors treat our analysis as a template for continued evaluation of this important topic.”
Now, on to the insights this research offers.
What are the Academic Insights?
- NO. There was no potential for portfolio protection exhibited over short term investment horizons. Cryptocurrencies moved in tandem with US equities regardless of the direction of returns. When stocks performed well or poorly, crypto performed in a similar manner.
- YES. BUT ONLY RECENTLY. The average or Pearson correlation was positive when returns were calculated on a monthly interval, an annual interval, or a 3-year interval. However, during specific periods of time, the returns between the 2 asset classes diverged significantly. There was also a structural shift noted at the beginning of 2018. During the 3-year period from 2018 to 2020, the co-movement of returns for cryptocurrencies and equities was negative. However, over the previous twenty-three 3-year sampling periods up to the end of 2017, little to no diversification potential was exhibited.

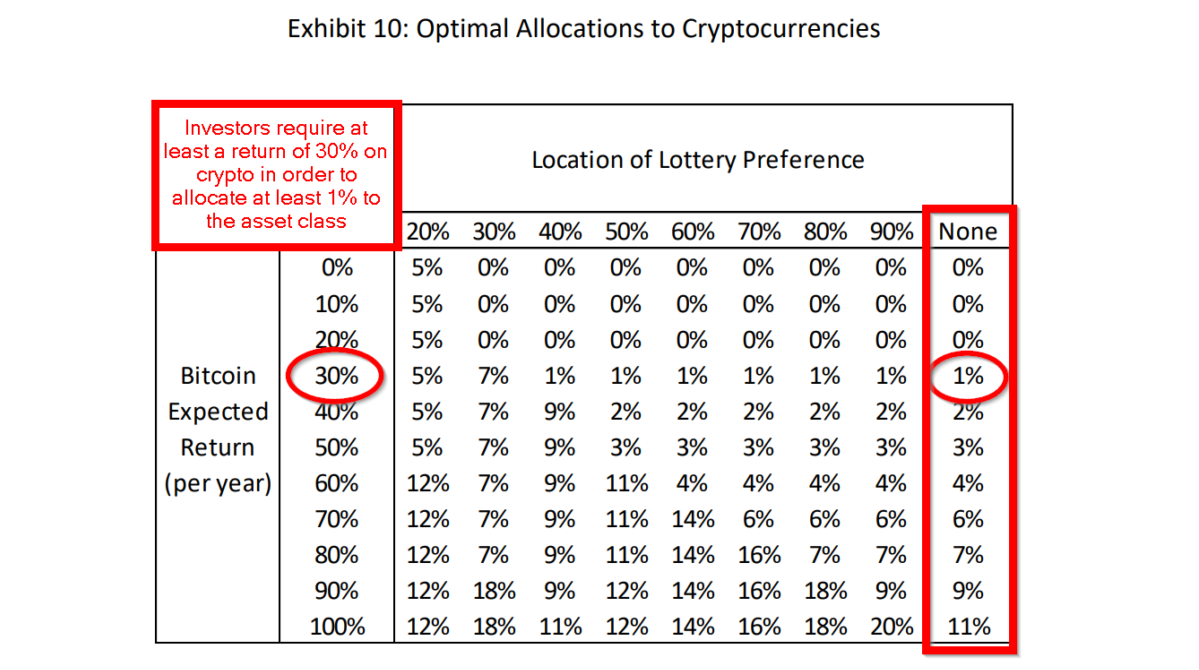
- YES. Results of the analysis on optimal allocation are presented in Exhibit 10 below. Portfolios were constructed across all aspects of the return spectrum, called a full-scale optimization, to determine the optimal allocation. Ignoring the complexities associated with the impact of “lottery preferences” on the part of investors, the analysis suggests that an expected return of 30% was necessary to justify an allocation, albeit only 1% to cryptocurrencies. At expected rates of return in the range of 100%, the allocation could rise to 11%.
Why does it matter?
In addition to presenting an analysis of the diversification potential of cryptocurrencies, the authors provide a tutorial on the drawbacks of using standard full sample estimates of the correlation matrix of asset classes over long and short investment horizons. The single period correlation is derived and tested as an alternative to the standard Pearson correlation coefficient as a superior approach to full sample methods. This latter contribution alone is worth the effort it takes to work through this paper regardless of the asset class under consideration.
The most important chart from the paper
Abstract
The role of cryptocurrencies as a vehicle for speculation has been well established. However, it is less clear if cryptocurrencies can also serve to manage risk. The authors seek to determine the diversification potential of cryptocurrencies both for short and long horizons. For short horizons, they estimate correlations that consider the direction and magnitude of returns for relevant asset classes, rather than focus on full-sample correlations, as is customary. For long horizons, they compute “single period correlations,” which capture the extent to which cryptocurrencies move synchronously or drift apart from other assets over an investor’s horizon. They also identify utility-maximizing allocations to cryptocurrencies directly from historical return samples that account for all features of the data as well as more nuanced preferences than typically assumed.

About the Author: Tommi Johnsen, PhD
—
Important Disclosures
For informational and educational purposes only and should not be construed as specific investment, accounting, legal, or tax advice. Certain information is deemed to be reliable, but its accuracy and completeness cannot be guaranteed. Third party information may become outdated or otherwise superseded without notice. Neither the Securities and Exchange Commission (SEC) nor any other federal or state agency has approved, determined the accuracy, or confirmed the adequacy of this article.
The views and opinions expressed herein are those of the author and do not necessarily reflect the views of Alpha Architect, its affiliates or its employees. Our full disclosures are available here. Definitions of common statistics used in our analysis are available here (towards the bottom).
Join thousands of other readers and subscribe to our blog.