One of the big problems for the first formal asset pricing model developed by financial economists, the CAPM, was that it predicts a positive relationship between risk and return. However, empirical studies have found the actual relationship to be basically flat, or even negative. Over the last 50 years, the most “defensive” (low-volatility or low-beta, low-risk) stocks have delivered both higher returns and higher risk-adjusted returns than the most “aggressive” (high-volatility, high-risk) stocks.
The superior performance of low-volatility (low-beta) stocks was first documented in the literature in the 1970s—by Fischer Black (in 1972) among others—even before the size and value premiums were “discovered.” The low-volatility anomaly has been shown to exist in equity markets around the world. Interestingly, this finding is true not only for stocks but for bonds as well. In other words, it has been pervasive.
My book, co-authored with Andrew Berkin, “Your Complete Guide to Factor-Based Investing,” included an in-depth discussion of the explanations for the existence and persistence of the anomaly. Among the explanations are
- Many investors are constrained against the use of leverage (by their charters) or have an aversion to its use. The same is true of short selling.
- Borrowing costs for some hard-to-borrow stocks can be quite high. Such limits can prevent arbitrageurs from correcting the pricing mistake.
- While an assumption of the CAPM is that markets have no frictions, meaning there are neither transaction costs nor taxes, in the real world there are costs. The evidence shows that the most mispriced stocks are the ones with the highest costs of shorting.
- Regulatory constraints, which often don’t differentiate between the risks of low-beta and high-beta stocks, lead some investors to prefer high-beta stocks.
- The preference for “lottery tickets”—high-beta stocks with a low average return but a small chance of a large return.
The academic research, combined with the 2008 bear market, led low-volatility strategies to become the darlings of investors.
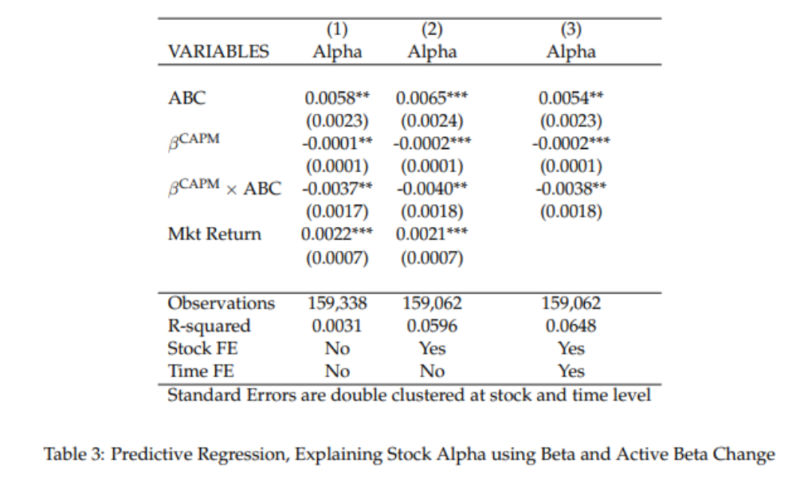
Andrea Hamaui and Pierre Jaffard contribute to the literature on the beta anomaly with their March 2021 study, “Chasing the Beta, Losing the Alpha.” They analyzed how mutual funds and large investors that are constrained in their ability to take leverage shapes their demand for high-beta assets depending on market conditions, thus generating the anomaly. They began by explaining: “As leverage constrained market players hold heterogeneous and non-rational expectations on market returns, they tilt their portfolio towards high Beta assets whenever they have bullish market expectations, while the opposite holds true when market return expectations are bearish. This way, driven by optimistic market expectations, they expand their demand for high Beta securities, which results in high prices today and negative alpha going forward. This pattern, coupled with stickiness in portfolio construction, generates a strong connection between the expectations of funds owning a specific stock and their future expected returns.” Their data sample covered the period 2004 to 2019. They used a fund’s beta variation in portfolio exposure to market risk to measure changes in expectations of market returns.
Following is a summary of their findings:
- A high-beta stock owned (and traded) by overoptimistic mutual fund investors tends to display low alpha going forward because overoptimistic investors want to increase their market exposure and hence tend to bid up high-beta stocks they own, generating low alphas going forward—which explains why stocks owned by overoptimistic investors tend to display the beta anomaly.
- All else equal, a stock characterized by a CAPM beta of 1.5 will experience approximately a 2.5 percent(1) lower alpha on an annualized return basis compared to a stock characterized by a CAPM beta of 1.
- Overoptimistic mutual funds tend to earn low returns going forward when the past market return was high, exactly when the average extrapolative investor is optimistic as well. The reason is that those overoptimistic mutual funds tend to buy high-beta stocks that are already quite expensive because the average extrapolative investor is bullish. Thus, the fund incurs future low alpha as it bought high-beta stocks that have low alphas going forward.
- The low-beta anomaly is missing when past market returns were low, although the beta anomaly portfolio displays an alpha that is close to being significant for stocks exposed to the most optimistic mutual funds.
- As hedge funds take the other side of the trade with respect to beta-chasing investors, when funding constraints are tight (as measured by the TED spread—the spread between three-month LIBOR and Treasury bills) they need to de-lever their bets against beta (their leveraged long position in low-beta stocks and short position in high-beta stocks). The result is that the magnitude of high-beta stock underperformance depends on the TED spread.
Their findings led Hamaui and Jaffard to conclude:
“Stocks owned by over-optimistic mutual funds tend to display a much stronger Beta anomaly. This effect is generated in our model by margin constraints, which lead optimistic investors to bid up the high Beta stocks they own.”
They added:
“Our empirical evidence co-exists with more traditional explanations of time-varying margin constraints affecting the other side of the trade.” And finally: “Our Active Beta Change belief measure also carries predictive power for fund returns, as over-optimistic funds engage into high Beta stocks’ trading that proves an inefficient way to tilt their market exposure upwards.”
The Performance of Low-Volatility ETFs
While the evidence demonstrates that investing in high-beta stocks is not a good strategy, that still leaves us with the question of whether low-beta strategies are effective. To help answer that question, using the regression tool at Portfolio Visualizer, we can analyze the performance of three popular low-volatility ETFs (a large-cap, a midcap, and a small-cap) through a factor-model lens. In the tables below, the loadings on each factor are in parentheses.
We’ll begin with the iShares MSCI USA Minimum Volatility ETF (USMV), which had almost $29 billion in assets as of April 14, 2021. Data is available for the period November 2011 through March 2021, and AQR factors are used. Note that the two fixed income factors of term and credit are included in the analysis, as studies such as the 2014 paper “A Study of Low-Volatility Portfolio Construction Methods” and the 2014 paper “Interest Rate Risk in Low-Volatility Strategies” have found that the term exposure helps explain the low-beta anomaly. The table presents the annualized alphas.
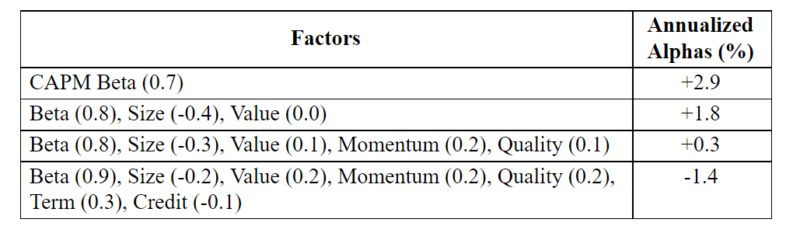
First, the loadings should not be surprising. For example, low-volatility stocks tend to be large (hence the negative loading on size) and high-quality, defensive stocks. The positive loading on term reflects the more bond-like nature of low-beta stocks. And the negative loading on credit reflects the high quality of low-volatility stocks.
Second, in terms of alpha, while low-volatility strategies have high alphas in a single-factor CAPM and three-factor world (hence the anomaly), the alphas turn negative once the newer factors of quality and term are considered. In other words, investors are better served by directly targeting exposure to these factors.
We see similar results looking at the performance of the Invesco S&P MidCap Low Volatility ETF (XMLV). The fund had assets of $1.6 billion as of April 14, 2021. The period covers the time for which data is available, from March 2013 through February 2021.
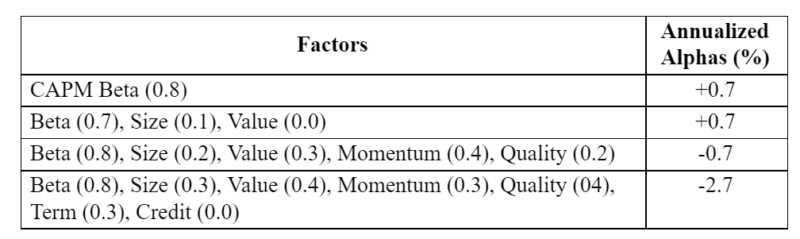
The only major difference in the results of the two funds is that, because XMLV is a midcap fund, it has a small positive exposure to the size factor. Again, once we account for all common exposures, the alphas turn negative.
We see similar results again when looking at the performance of the Invesco S&P SmallCap Low Volatility ETF (XSLV). The period is also March 2013 through February 2021. The fund had assets of $1.2 billion as of April 14, 2021.
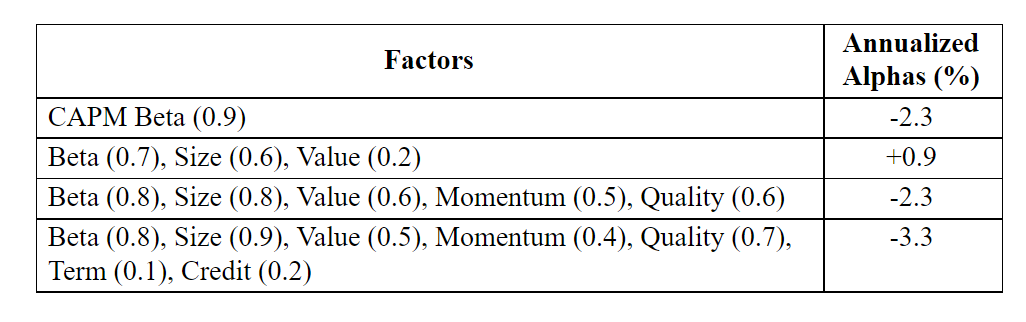
Among the three low-volatility funds we examined, there are almost $33 billion in assets generating large negative risk-adjusted alphas. It’s hard to imagine that investors are aware of this.
Takeaways
There are two takeaways for investors. The first is that investors should avoid investing in funds that invest in high-beta stocks, especially following periods of past strong returns when investors tend to be the most optimistic and thus have bid up the prices of high beta stocks. The second is that once implementation costs are considered, investors appear to be better served by targeting the other factors that explain the variation of returns (size, value, momentum, quality, term, and credit) directly.
Important Disclosures
The information contained in this article is for educational purposes only and should not be construed as specific investment, accounting, legal or tax advice. The analysis contained in this article is based upon third party information available at the time which may become outdated or otherwise superseded at any time without notice. Third-party information is deemed to be reliable, but its accuracy and completeness cannot be guaranteed. By clicking on any of the links above, you acknowledge that they are solely for your convenience, and do not necessarily imply any affiliations, sponsorships, endorsements or representations whatsoever by us regarding third-party websites. We are not responsible for the content, availability or privacy policies of these sites, and shall not be responsible or liable for any information, opinions, advice, products or services available on or through them. The opinions expressed by featured authors are their own and may not accurately reflect those of the Buckingham Strategic Wealth®, Buckingham Strategic Partners® (collectively Buckingham Wealth Partners). LSR-21-64

About the Author: Larry Swedroe
—
Important Disclosures
For informational and educational purposes only and should not be construed as specific investment, accounting, legal, or tax advice. Certain information is deemed to be reliable, but its accuracy and completeness cannot be guaranteed. Third party information may become outdated or otherwise superseded without notice. Neither the Securities and Exchange Commission (SEC) nor any other federal or state agency has approved, determined the accuracy, or confirmed the adequacy of this article.
The views and opinions expressed herein are those of the author and do not necessarily reflect the views of Alpha Architect, its affiliates or its employees. Our full disclosures are available here. Definitions of common statistics used in our analysis are available here (towards the bottom).
Join thousands of other readers and subscribe to our blog.