This is the second article in a series on women in leadership roles, find the first post here. In this original research, Elisabetta and I study data across 29 global markets and provide empirical data on the following question:
What percentage of COO, CCO, and CTO roles do women fill in the global marketplace?
THE GLOBAL MEDIANS
We analyzed 36,499 functional positions for the COO, CCO, and CTO roles in 29 countries, including 25 developed markets and Brazil, Russia, India, China (the “BRICs”). All public and private firms in the finance industry were included regardless of market capitalization or other characteristics.
The global medians for female representation painted quite a mixed picture for the “operations” leadership positions. The median for the CCO was highest at 38%, with 21% for COOs and 8% for CTOs.
Remarkably, we noticed a fairly strong relationship across European countries with high representation in all three roles. Eleven (38%) of 29 countries were found to be above the median for the CCO role, nine (31%) for the COO role, and seven (24%) for CTO. Kudos to the Netherlands, Norway, Spain, Sweden, and France!
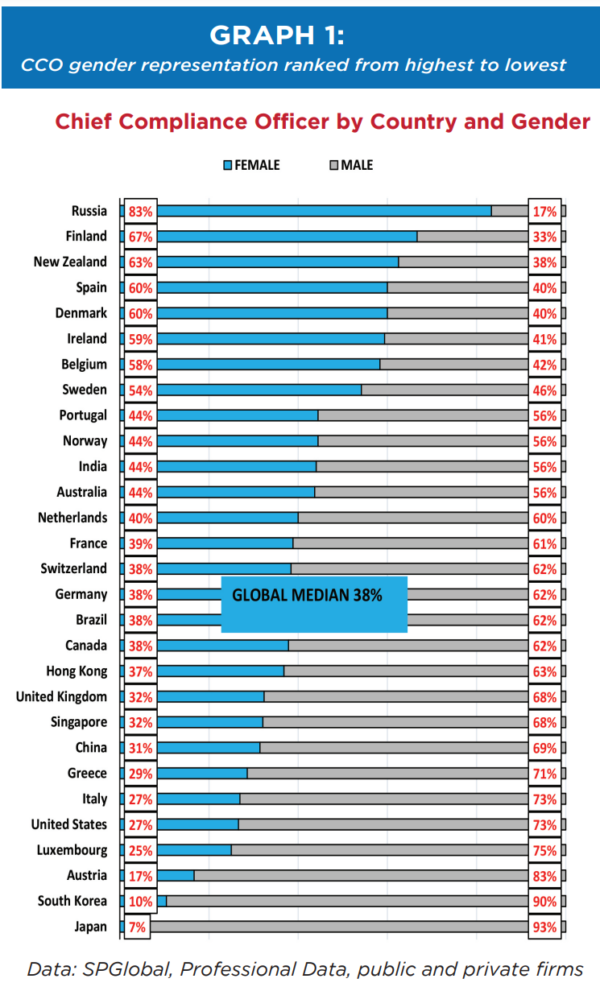
The CHIEF COMPLIANCE OFFICER
Our findings show that a number of countries have a significant female representation in the Chief Compliance Officer position. We analyzed 18,256 positions of Chief Compliance Officer globally and as shown in graph 1, the country with the highest female CCO representation was Russia at 83%, while the country with the lowest female representation was Japan at 7%.
While the number 1 position went to Russia, 10 European countries plus New Zealand, India, Australia scored above the global median. The US Labor Department reports that compliance is one of the fastest-growing professions for women and is currently pegged at 54.2% on average for all sectors in the US. This comes as no surprise given research
documenting that women have a natural propensity for avoiding risk (Lundeberg, Fox, and Puncochar, 1994), whereas men tend towards overconfidence in financial matters (Prince, 1993).
It seems that the popularity of the compliance function among women may depend on the straightforward nature of the job itself. Unlike analysts, traders, and portfolio managers, the compliance role is characterized by less ambiguity and more immediate feedback. Differences in self-confidence between the genders depend on the lack of clear and unambiguous feedback (Lenney, 1977). This may explain the relatively smaller gender gap we observed for CCOs.
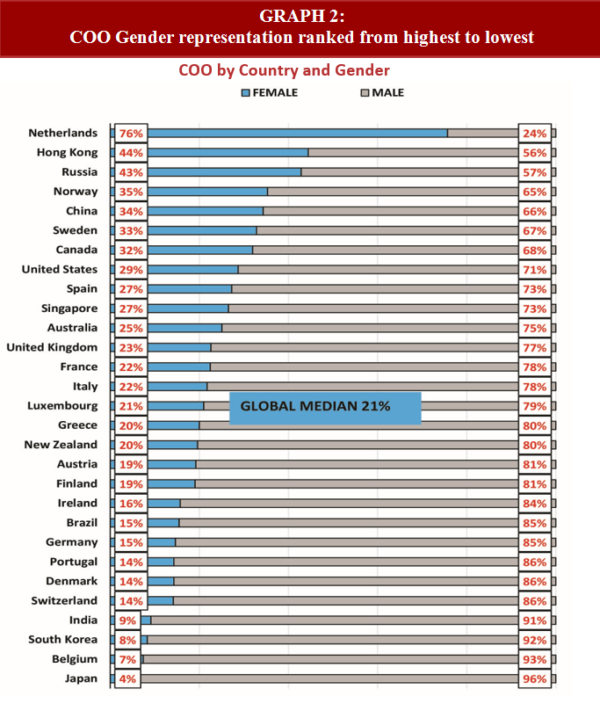
THE CHIEF OPERATING OFFICER
Results for the Chief Operating Officer are presented in graph 2. A global median of 21% was calculated from the analysis of 15,440 positions. A wide range of outcomes was observed. The Netherlands, at 76%, exhibited the highest female representation and as with the CCO position, Japan ranked at the bottom of the list at 4%.
Two of the BRICs, Russia, and China, scored at or above the global median while Brazil and India were well below the median. Eight European countries along with the United States and Canada again scored well above the median.
The United States compares favorably to the global median with a 29% female representation. In the US, the financial sector is also better positioned relative to other sectors, where female COOs represent only 8.5% of the total.
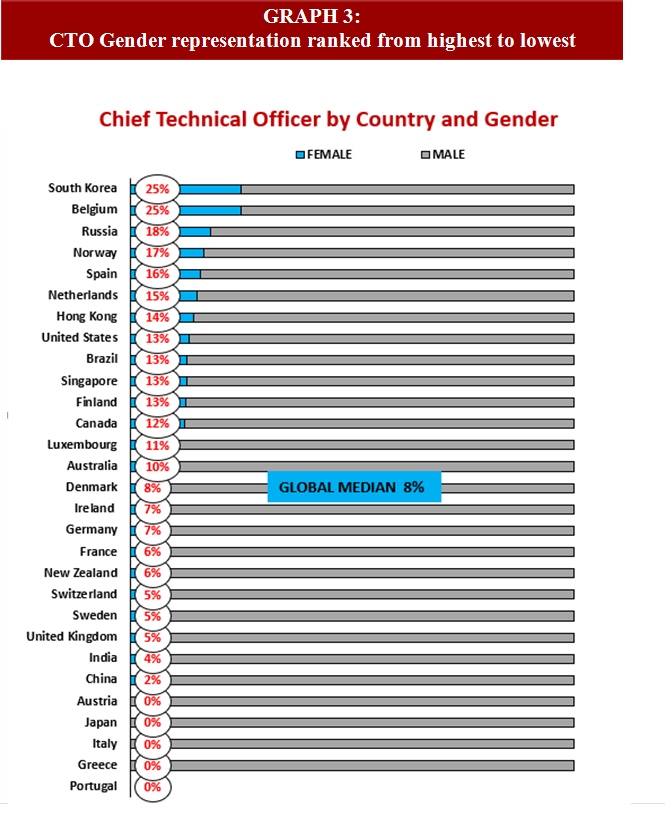
THE CHIEF TECHNOLOGY OFFICER
It is well-documented that women are underrepresented in IT executive positions, and the chief technology officer (CTO) role is no exception. In fact, this position is among those with the lowest global medians.
We analyzed 2,803 positions of Chief Technology Officer in the finance industry. The global median was a meager 8% and both South Korea and Belgium, at 25%, as shown in graph 3, were the countries with the highest female representation. Austria, Japan, Italy, Greece, and Portugal exhibited zero female representation in this leadership position.
Two of the BRIC’s countries, Russia and Brazil, scored at or above the global median while the remaining two, China and India, were well below the median. Seven European countries along with the United States and Canada again scored well above the median.
The gender gap for the CTO in financial services compares favorably to the overall average of 9% for all sectors combined according to research published by Gartner (2019). However, keeping the pipeline primed is a challenge. Although more women are choosing to grow their careers in technology, it will take time for women to move through the ranks and into technology leadership roles (Korn Ferry, 2019).
The pipeline problem in technology can be explained to some degree by the gender gap in math and STEM disciplines. Researchers report that the gender gap in math develops over the first six years of schooling. At the entrance to the elementary level of the school, it really doesn’t exist. However, by year six, females are observed to lose two-tenths of one standard deviation in scores on standardized math tests. The math gap is equivalent to 2.5 months of schooling. (Fryer and Levitt, 2009).
Interestingly, there are country and socio-economic interactions. For example, the gap did not materialize in Muslim countries, which was the single exception worldwide according to Fryer and Levitt (2009). Others report that the gender gap varies by race and socioeconomic status and it is most pronounced among white affluent girls (Dossi et al., 2020) .
WHAT ARE THE ACADEMIC INSIGHTS?
CTOs play a prominent role in directing and shaping corporate innovation strategies, which are at the core of corporate survival and increasing shareholder value.
Responsibilities of the CTO range from conducting oversight of the selection process for research projects, to monitoring and assessing new technologies for potential adoption.
Academic studies have consistently documented a positive relationship between board gender diversity and firm innovation (Miller and Triana, 2009). Female representation on top management teams improves firm performance especially when the strategy is focused on innovation (Dezso and Ross, 2012).
However, a recent paper ( Wu et al., 2021) singles out the CTO. Using 5,408 firm-year observations between 1991 and 2010, the authors found a significant and positive relation between CTO gender and innovation, as measured by both patent counts and patent citations. For example, When compared to their male counterparts, female CTOs exhibited a rate 1.826 times greater for patent counts, and a rate 1.741 times greater for patent citations. Additionally, the culture and environment enhanced the effect. The researchers found that the CTO gender effect is more pronounced for firms with a stronger supportive culture for innovation and when the CTO is more “powerful”.
That is, if the female CTO also doubles as the CEO, the President, an executive/senior VP, or a member of the board, the effect is enhanced considerably.

You can find a pdf version of this scorecard here
References
Dezso, C.L. and Ross, D.G., 2012. Does female representation in top management improve firm performance? A panel data investigation. Strategic Management Journal.
Dossi, G., Figlio, D., Giuliano, P., and P. Sapienza, 2020, The Family Origin of the Math Gender Gap is a White Affluent Phenomenon, NBER Working Paper
Fryer, R.G. and S.D. Levitt, 2009, An Empirical Analysis of the Gender Gap in mathematics, NBER Working Paper
Logan, D., and S. Searle, 2019, CTO Insights: How to Fix the CTO Gender Gap, Gartner Research
Lutton, L., and E.Davis, 2015,Morningstar Research Report: Fund Managers by Gender, Morningstar Research Report
Miller, T. and Triana, M., 2009, Demographic diversity in the boardroom: mediators of the board diversity–firm performance relationship, Journal of Management Studies
Wu, Q.,Dbouk, W., Hasan, I.,Kobeissi, N.,Zheng, Li., Does Gender Affect Innovation? Evidence
from Female Chief Technology Officers,Research Policy, 2021


About the Author: Tommi Johnsen, PhD
—
Important Disclosures
For informational and educational purposes only and should not be construed as specific investment, accounting, legal, or tax advice. Certain information is deemed to be reliable, but its accuracy and completeness cannot be guaranteed. Third party information may become outdated or otherwise superseded without notice. Neither the Securities and Exchange Commission (SEC) nor any other federal or state agency has approved, determined the accuracy, or confirmed the adequacy of this article.
The views and opinions expressed herein are those of the author and do not necessarily reflect the views of Alpha Architect, its affiliates or its employees. Our full disclosures are available here. Definitions of common statistics used in our analysis are available here (towards the bottom).
Join thousands of other readers and subscribe to our blog.