“Employees are our greatest asset” is a phrase often heard from companies. However, due to accounting rules requiring that most expenditures related to employees be treated as costs and expensed as incurred, the value of employees is an intangible asset that does not appear on any balance sheet. That leaves the interesting question of whether employee satisfaction provides information on future returns.
Ashwini Agrawal, Isaac Hacamo, and Zhongchen Hu sought to answer that question in their study “Information Dispersion Across Employees and Stock Returns,” published in the October 2021 issue of The Review of Financial Studies. To test their hypothesis that rank-and-file entry and exit decisions reflect information observed by workers that are not incorporated into prices by investors, they used LinkedIn to analyze a randomized sampling strategy of more than 1 million employees who had worked for publicly traded companies in the U.S. Their dataset represented a sample of workers who had been employed by Russell 1000 firms sometime between 1985 and 2016. They reviewed the CVs (Curriculum Vitae) of individual users of the platform, identifying the start and end dates of job spells to construct a sample of monthly labor flows at the Russell 1000 firms.
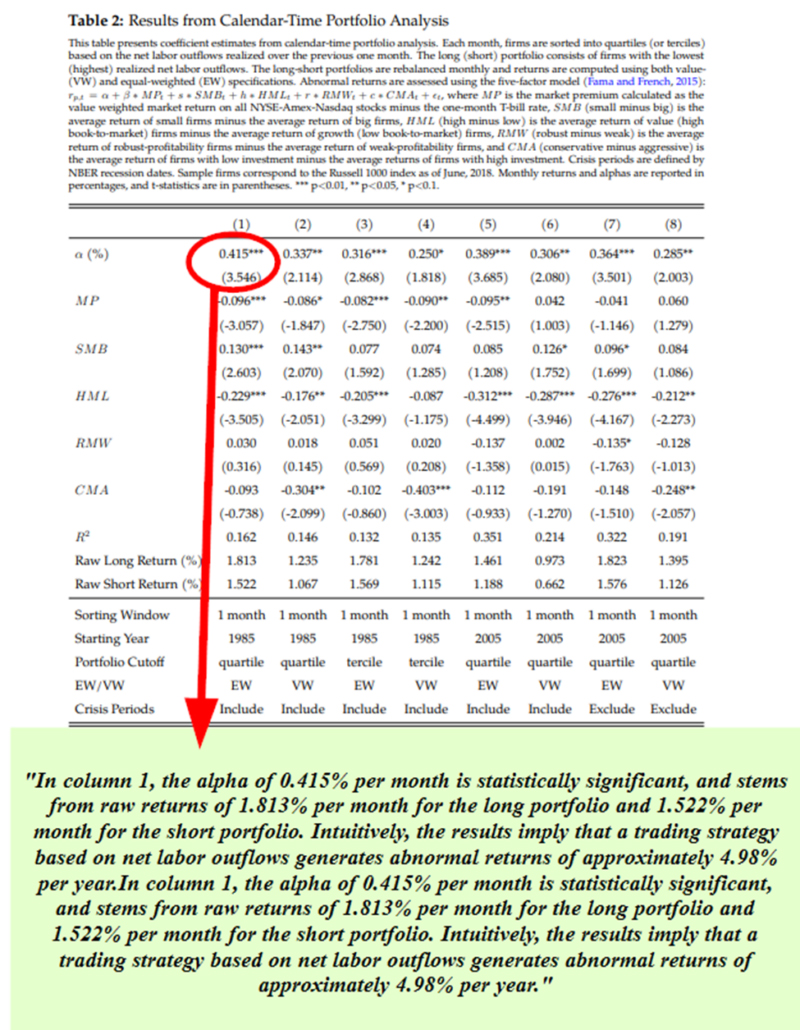
Their hypothesis was that workers observe informative signals about the firm’s future prospects and use these signals to update their wage expectations at the firm. In response to negative (positive) signals, workers become more likely to exit (join) the firm. Net labor flows (the difference between gross labor outflows and inflows over a given month divided by total employment at the start of the month) reflect the aggregation of this information across workers. If investors do not infer this information from labor flows and immediately incorporate it into stock prices, we will observe a link between labor flows and future stock returns. Following is a summary of their findings:
- Labor flows predict future abnormal stock returns—a trading strategy that goes long firms with net labor inflows and short firms with net labor outflows yielded a statistically significant abnormal return of 5 percent per annum.
- Net labor flows of highly skilled workers such as engineers, scientists and middle managers—workers who are central to the firm’s operations and able to directly observe the firm’s production process—were highly predictive of abnormal stock returns, while other types of labor flows were less informative about future performance.
- The link between gross labor outflows and abnormal stock returns was more pronounced than the link between gross labor inflows and abnormal stock returns.
- Increases in net labor outflows were predictive of reductions in corporate earnings, primarily through increases in operating expenses and SG&A (selling, general and administrative expenses).
- Equity analysts and investors do not appear to fully incorporate information from labor flows into their corporate earnings expectations—they consistently overestimate (underestimate) the earnings of firms that experience high (low) net labor outflows.
- Firms in the long portfolio were characterized by earnings surprises that were positive on average, while firms in the short portfolio exhibited earnings surprises that were negative on average (the difference in average earnings surprises between the two portfolios was statistically significant).
- For newly listed firms that are likely to be harder for investors to evaluate given their limited operating histories, their trading strategy yielded abnormal returns of approximately 1.1 percent per month in the immediate three years following an initial public offering. Similar results were found for firms that were more opaque (for example, heavily used accruals to manage earnings) in providing financial information.
Of particular interest was their finding that insider trading patterns suggest that managers do not act upon adjustment costs triggered by departing workers. In addition to these findings, the authors conducted their own large-sample survey of the LinkedIn users who comprised their sample. They found that workers report that their employers’ future prospects factored heavily into their past entry and exit decisions and were generally more important to their decisions than idiosyncratic factors such as family considerations. They also found that prospective employees frequently report gathering information about a firm through its existing employees before deciding whether to join the company.
Growing Body of Literature on Labor Force Dynamics and Asset Prices
Agrawal, Hacamo, and Hu’s study adds to a rapidly growing body of literature that seeks to understand how the firm’s labor force dynamics matter for asset prices and corporate behavior. We will review the findings from several papers, beginning with the 2013 study “Does the Stock Market Fully Value Intangibles? Employee Satisfaction and Equity Prices.”
The author, Alex Edmans, analyzed the relationship between employee satisfaction and long-run stock returns. His hypothesis was that employees are key organizational assets, rather than expendable commodities, who can create substantial value by inventing new products or building client relationships, which benefits shareholders. This is especially true for modern knowledge-based industries, such as pharmaceuticals or software. In addition, high employee satisfaction can be a valuable recruitment tool.
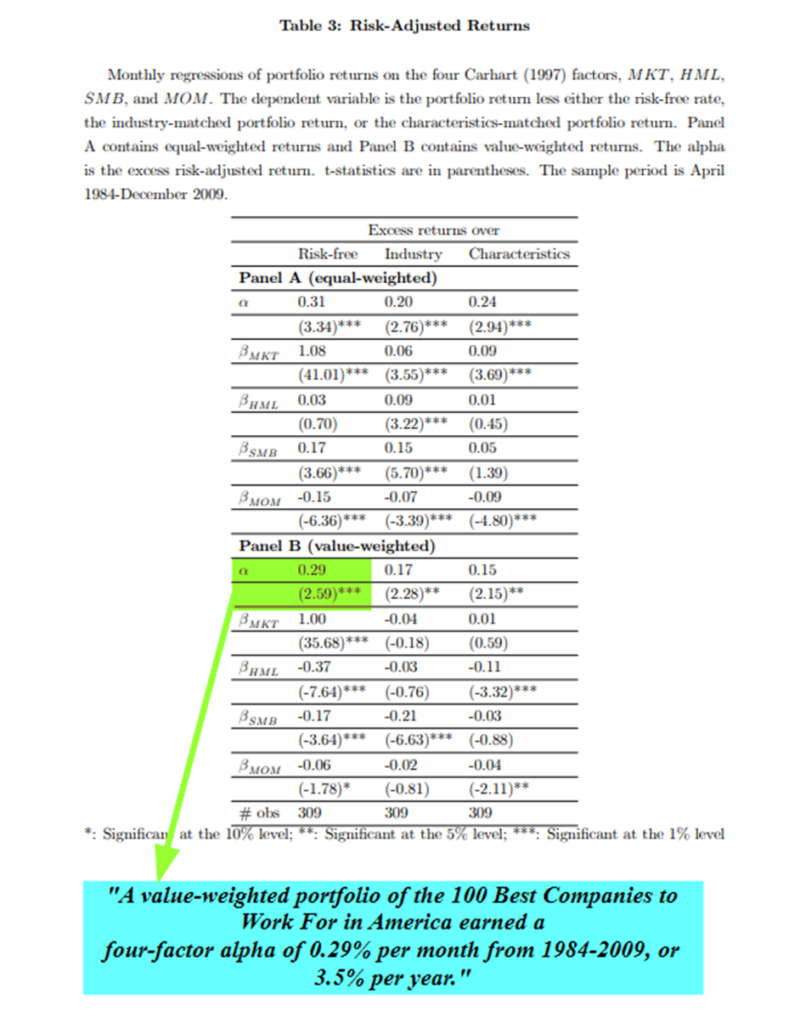
Edmans began by noting that research had found that firms with high R&D, advertising, patent citations, and software development costs had all earned superior long-run returns. He hypothesized that the market may be even more likely to undervalue employee satisfaction because the theory has ambiguous predictions for whether it is desirable for firm value. His database was the list of the 100 Best Companies to Work for in America (typically, 50 to 70 are publicly traded). The list was first published in a book in March 1984 and updated in February 1993. Since 1998 it has been featured in Fortune magazine each January. It is compiled from two principal sources. Two-thirds of the score comes from employee responses to a 57-question survey created by the Great Place to Work Institute in San Francisco covering topics such as attitudes toward management, job satisfaction, fairness, and camaraderie. Two hundred fifty employees across all levels are randomly selected in each firm. The remaining one-third of the score comes from the Institute’s evaluation of factors such as a company’s demographic makeup, pay and benefits programs, and culture. The companies are scored in four areas: credibility (communication to employees), respect (opportunities and benefits), fairness (compensation, diversity), and pride/camaraderie (teamwork, philanthropy, celebrations). Following is a summary of his findings:
- There is a strong, robust, positive correlation between satisfaction and shareholder returns—firms with high levels of employee satisfaction generate superior long-term returns even when controlling for industries or factor risk.
- A value-weighted portfolio of the 100 Best Companies to Work For earned an annual four-factor alpha of 3.5 percent over the period 1984-2009 and 2.1 percent above industry benchmarks. The returns were slightly higher when equal weighted.
- The results were robust to controls for firm characteristics, different weighting methodologies and the removal of outliers.
- The Best Companies also exhibited significantly more positive earnings surprises and announcement returns.
- The market learns about the true value of employee satisfaction over time as it releases positive tangible news (positive earnings surprises)—the benefit of list inclusion declines over time and becomes insignificant in the fifth year.
- Buying stocks dropped from the Best Companies list or not updating the portfolio for future lists leads to lower returns than holding the most current list.
His findings led Edmans to conclude that employee satisfaction is positively correlated with shareholder returns, the stock market does not fully value intangibles, and certain socially responsible investing (SRI) screens may improve investment returns. He also offered this explanation for the outperformance of the Best Companies to Work For:
“Investors use traditional valuation methodologies, devised for the 20th century firm and based on physical assets, which cannot incorporate intangibles easily.”
He added that prior research had found that
“strong governance earned abnormal returns while trading at a valuation premium at the start of the return window. The higher ratios suggest that the market is at least partially valuing the intangibles.”
Edmans’ findings are consistent with those of global index provider FTSE Russell, which found that an equal-weighted index of the publicly traded companies among the 100 Best returned 11.7 percent annually from 1998 (when Fortune began publication of the list) through 2016, 5 percent more than the equivalent returns for both the Russell 3000 and Russell 1000 Indices.
Further Evidence
Kyle Welch and Aaron Yoon contributed to the literature with their June 2020 study, “Corporate Sustainability and Stock Returns: Evidence from Employee Satisfaction,” in which they examined whether ESG (environmental, social, and governance) coupled with employee satisfaction can enhance firm value. They began by noting that prior research, including the 2018 study “Crowdsourced Employer Reviews and Stock Returns,” had found that firms experiencing improvements in crowdsourced employer ratings significantly outperform firms with declines and thus is an important determinant of firm value. They hypothesized that
“firm engagements in ESG may instill a sense of purpose to employees and motivate them. In addition, motivated employees will be more productive, which may lead to enhanced firm value. In such a case, it is possible that ESG coupled with employee satisfaction may enhance firm value over and beyond the effect from employee satisfaction.”
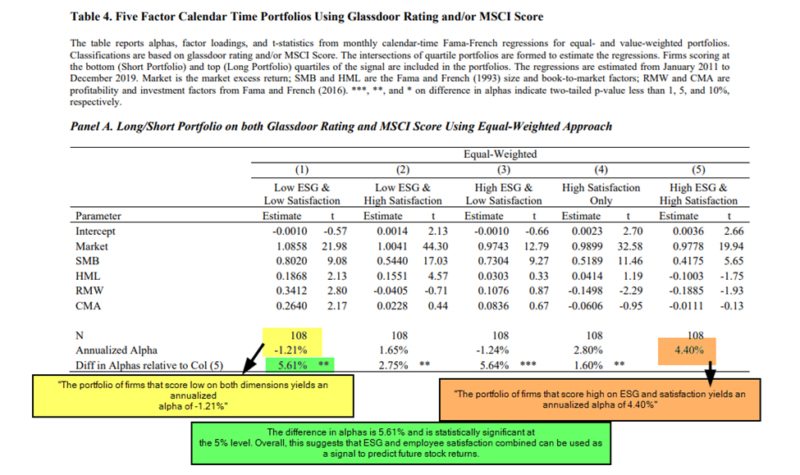
Their data was from MSCI ESG Ratings and Glassdoor (for employee satisfaction) which covered the period 2011-18. Returns were benchmarked against the Fama-French five-factor model (beta, size, investment, profitability, and value). Their main findings were that when using employee satisfaction as the only signal to create portfolios, the long/short portfolio generated an annual equal-weighted (value-weighted) alpha of 2.4 percent (2.4 percent) and that firms with high ratings on both ESG and employee satisfaction did even better, returning 5.6 percent (5.8 percent).
The last paper we will review is from Kai Wu, author of the August 2021 paper “Measuring Culture.” He began by noting:
“Company culture is widely recognized to be a key intangible asset, yet few investors have attempted to formally measure it.”
The problem, he explained, is that:
“culture is a fuzzy concept, whose many facets cannot be reduced to a single number. Moreover, there is no consensus around what exactly is a ‘good’ culture. Amazon’s culture is held up as a paragon of both innovation and brutality.”
To solve the problem, Wu used natural language processing to build multidimensional culture profiles for each company and demonstrated that culture can be measured, as can its impact, which may be underappreciated by the market.
To examine the values held by rank-and-file employees (which can be very different from the values espoused by the CEO and the company—80 percent of large companies post their values on their website), Wu used Glassdoor, which provides a forum for current and former employees to post reviews of their employers. Over the past decade, millions of reviews have been posted on the website. Glassdoor allowed Wu to examine if companies “walk the talk.”
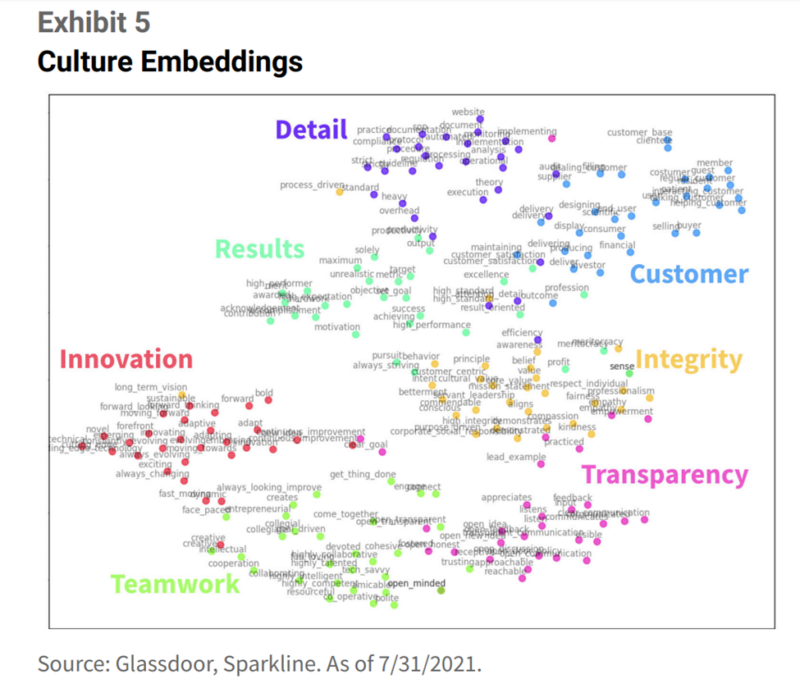
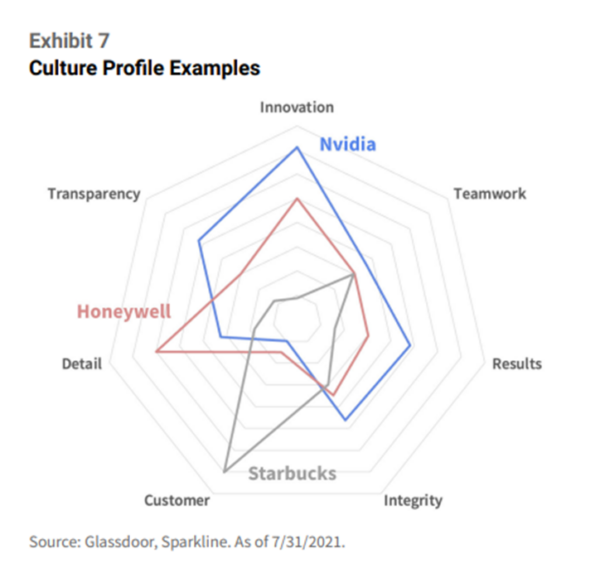
Wu noted that research had found that seven broad categories of the above values explain a large part of a company’s culture and also provide information on employee satisfaction. The seven categories—innovation, teamwork, results orientation, integrity, customer orientation, detail orientation, and transparency—make up a company’s organizational culture profile (OCP). Wu used the OCP framework to define the seven dimensions of company “personality” and then analyzed how it correlated with future equity performance. He built culture profiles from both employee reviews and earnings calls for the same company, allowing him to contrast what management said is their culture with the beliefs of rank-and-file employees. Among his findings was that firms with strong cultures (based on the seven OCP dimensions) have outperformed the stock market, while those with toxic cultures have lagged—corporate culture matters, providing information on expected returns.
Wu’s findings led him to conclude that employee goodwill is an intangible asset that enables firms to achieve their goals:
“Treating your employees well builds up a reserve of goodwill, which is paid back in the form of greater motivation and loyalty. Furthermore, happy employees are more likely to spread the word, enhancing brand and recruiting efforts.”
He added:
“Culture is an important type of intangible capital. Culture provides a moat around a firm’s human capital. The rising importance of human capital in the knowledge economy implies that this moat is becoming increasingly key.”
Investor Takeaway
A growing body of evidence demonstrates that labor flows reflect an aggregation of the information observed by workers that pertains to the firm’s future prospects and that this information can be used to predict stock returns if investors fail to extract it from labor flows and immediately incorporate it into stock prices. Possible explanations for the delay in incorporating labor flow information into prices include behavioral ones, such as investors being overconfident in their preexisting views about firms’ future earnings and the information reflected by labor flows simply taking time to permeate through financial markets.
Given that labor flows for individual companies can be constructed in real-time at low cost using LinkedIn’s own search engine and that many other publicly available sources of data can be used to construct labor flows across firms (such as the U.S. Patent Office information on key scientists and their company affiliations and other social media platforms and news databases) using natural language processing techniques (artificial intelligence) to collect information on key workers who enter and exit specific firms, it seems logical that sophisticated investors will increase their use of these tools and incorporate them into their trading strategies.
Important Disclosures
For informational and educational purposes only and should not be construed as specific investment, accounting, legal, or tax advice. Indices are not available for direct investment. Their performance does not reflect the expenses associated with the management of an actual portfolio nor do indices represent results of actual trading. By clicking on any of the links above, you acknowledge that they are solely for your convenience, and do not necessarily imply any affiliations, sponsorships, endorsements or representations whatsoever by us regarding third-party websites. We are not responsible for the content, availability or privacy policies of these sites, and shall not be responsible or liable for any information, opinions, advice, products or services available on or through them. The opinions expressed by featured authors are their own and may not accurately reflect those of the Buckingham Strategic Wealth® or Buckingham Strategic Partners® collectively Buckingham Wealth Partners. Neither the Securities and Exchange Commission (SEC) nor any other federal or state agency have approved, determined the accuracy or adequacy of this article. LSR-21-1

About the Author: Larry Swedroe
—
Important Disclosures
For informational and educational purposes only and should not be construed as specific investment, accounting, legal, or tax advice. Certain information is deemed to be reliable, but its accuracy and completeness cannot be guaranteed. Third party information may become outdated or otherwise superseded without notice. Neither the Securities and Exchange Commission (SEC) nor any other federal or state agency has approved, determined the accuracy, or confirmed the adequacy of this article.
The views and opinions expressed herein are those of the author and do not necessarily reflect the views of Alpha Architect, its affiliates or its employees. Our full disclosures are available here. Definitions of common statistics used in our analysis are available here (towards the bottom).
Join thousands of other readers and subscribe to our blog.