A few quick charts for our readers.
As we all know, technology-related sectors and names have been crushed. But how does that show up in valuations?
Turns out, the S&P 500 ex-technology is actually more expensive than the S&P 500, suggesting that large-cap tech might be relatively cheap…but the devil is in the details. (editor’s note: when our quantitative value algorithm is buying a lot of tech stocks, we will officially label technology as ‘deep value’).
First, the high-level valuations on the S&P 500 w/ and w/o technology-related sectors:
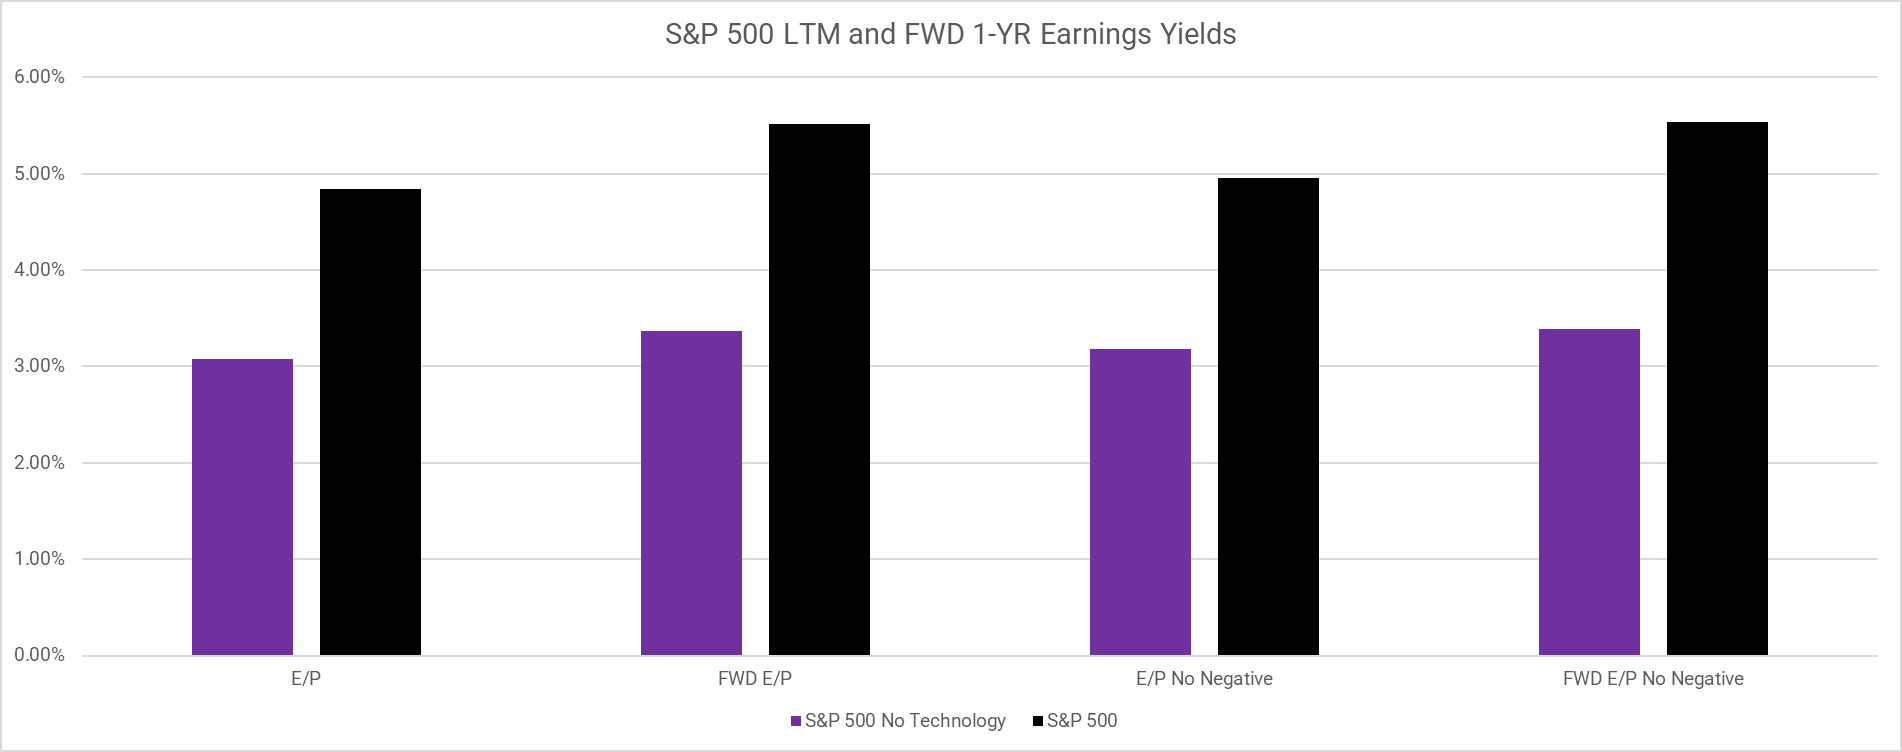
Key Points:
- Using trailing or fwd earnings yields doesn’t change the story: Including technology makes the S&P 500 more ‘valuey’.
- Eliminating negative E/P or FWD E/P does not change the story.
What’s driving that result? Answer: large-cap tech, not small-cap tech…we’ll explain next.
The analysis above is done on a holdings-weighted basis and therefore tells the story of stocks that represent the largest allocations. Below is an analysis on an equal-weight basis, which provides a view of how the average stock contributes to valuations versus how the largest stocks contribute to valuations. This analysis will put less weight on large stocks and more weight on smaller stocks.
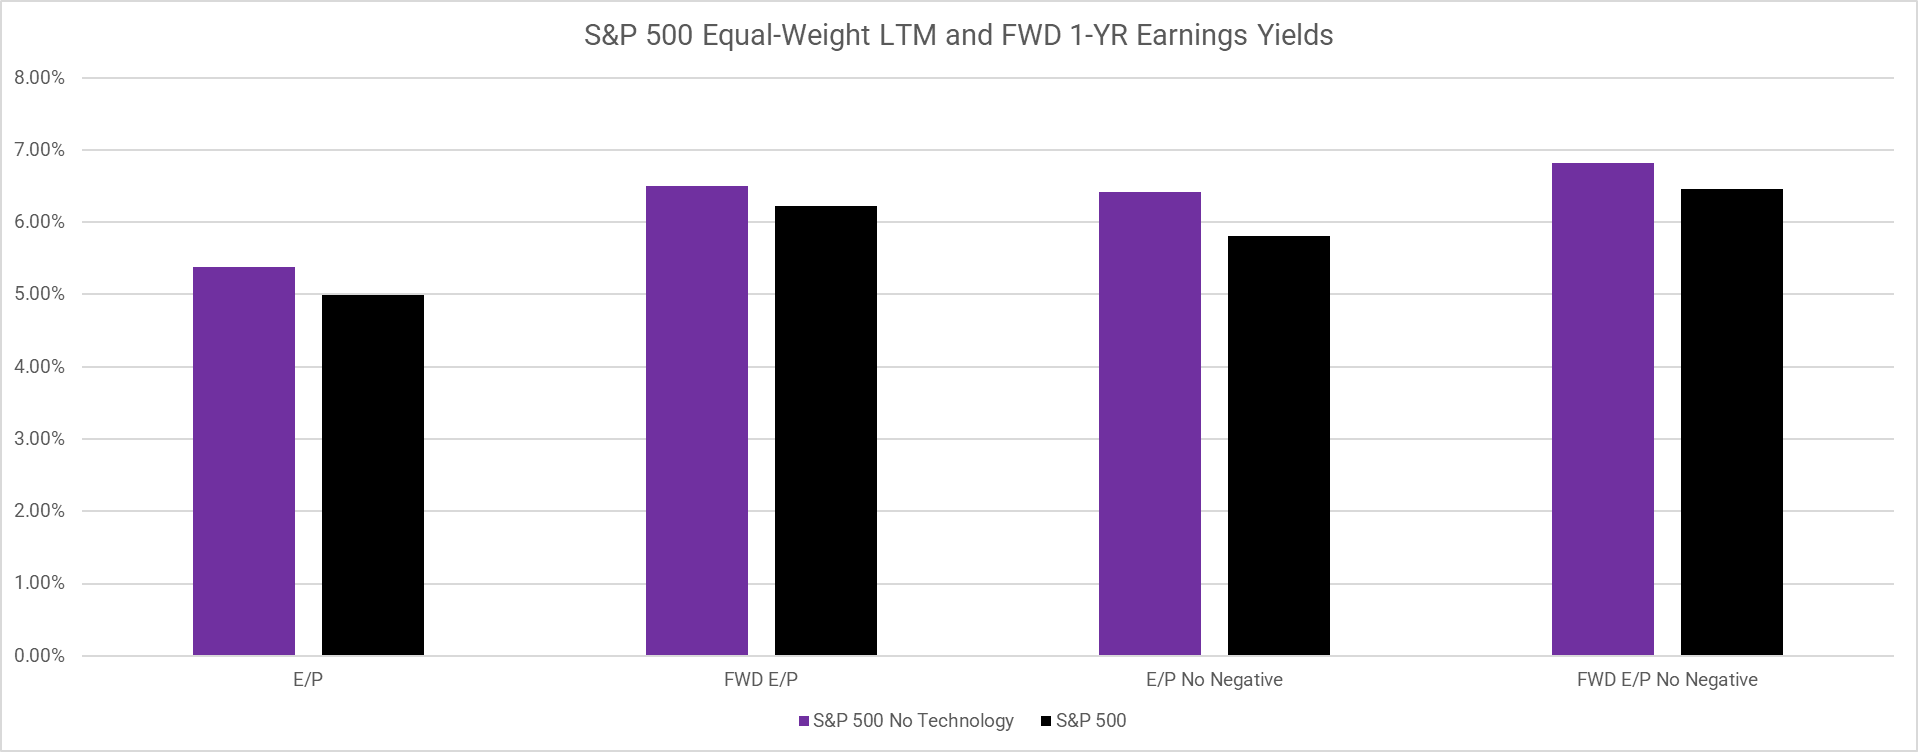
Key Points:
- An equal-weight SP 500 portfolio that eliminates tech is cheaper than one that includes tech (i.e., opposite result from above).
- Smaller technology firm valuations are still expensive relative to the rest of the market.
- Market-cap, or holdings-weighted, analysis is different than the equal-weight analysis => large-cap tech might be cheap.
And here are the charts with a breakdown by sector (these are equal weight averages of all companies in a sector vs. holdings weighted like above, which provides a different perspective).
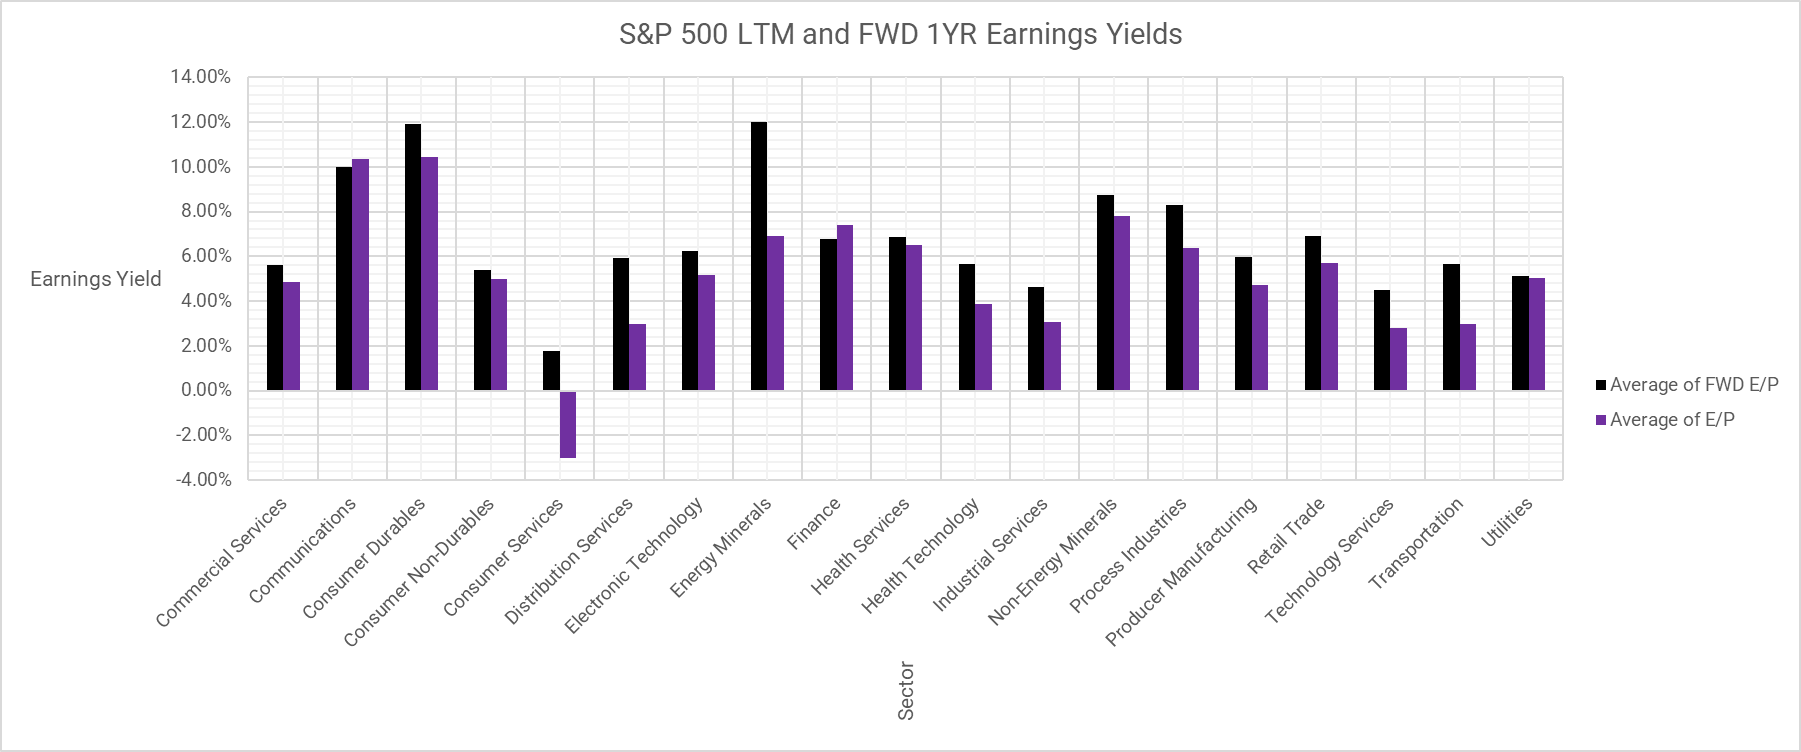
Key Points:
- Value sectors are cheap on a historical basis AND on a forward earnings basis.
- Technology sectors are generally more expensive on a historical and fwd earnings basis.
- Energy minerals and consumer durables are dirt cheap relative to the other sectors (get what you pay for?)
Appendix
- Dataset is Factset as of 5/23/2022.
- We use SPY holdings weights as a surrogate for the S&P 500 index.
- We eliminate observations where there is no available data.
- My internal, Wes Gray Ph.D., helped provide data analysis.
About the Author: Ryan Kirlin
—
Important Disclosures
For informational and educational purposes only and should not be construed as specific investment, accounting, legal, or tax advice. Certain information is deemed to be reliable, but its accuracy and completeness cannot be guaranteed. Third party information may become outdated or otherwise superseded without notice. Neither the Securities and Exchange Commission (SEC) nor any other federal or state agency has approved, determined the accuracy, or confirmed the adequacy of this article.
The views and opinions expressed herein are those of the author and do not necessarily reflect the views of Alpha Architect, its affiliates or its employees. Our full disclosures are available here. Definitions of common statistics used in our analysis are available here (towards the bottom).
Join thousands of other readers and subscribe to our blog.