In this article, we examine the research that addresses the question of whether or not democracy leads to better possible outcomes for the stock market.
Democracy and Stock Returns
- Xun Lei and Tomasz Piotr Wisniewski
- SSRN Working Paper
- A version of this paper can be found here
- Want to read our summaries of academic finance papers? Check out our Academic Research Insight category.
What are the research questions?
The literature on this topic is surprisingly meager. One notable study was published by Lehkonen and Heimonen (2015) documenting a positive relationship between stock returns and levels of democracy. They used a limited sample to do so: emerging markets observed over the period 2000 to 2012. The working paper summarized here improves that work by expanding the sample to 74 markets, including developed markets where annual returns are analyzed over the period 1975 to 2015. This sample represents most, if not all, of the investible opportunity sets available on a global basis. The increased number of observations used allows stronger conclusions to be drawn in terms of statistical significance.
- Is there an association between levels of democratization and stock returns?
- Is a profitable trading strategy based on the democracy index feasible?
What are the Academic Insights?
- YES. The results presented in Figure II clearly show a strong linear relationship between returns and the democracy variable, Polity IV, sourced from the Polity IV Project database. Regressions conducted on equity returns, democracy scores, and control variables produced consistently positive and statistically significant results. From an economic point of view, the slope on the democracy variable was 0.0706, indicating that for every 1% increase in the Polity index, the return on the country index increased by 7.06%. Robustness checks on the democracy index were conducted using the political rights variable sourced from Freedom House. That measure covers 192 countries. Control variables included macroeconomic measures including growth in GDP, per capita GDP, inflation, real risk-free rates, financial openness, and various political and religious indicators. The reader is referred to Table 1 in the paper for a complete listing.
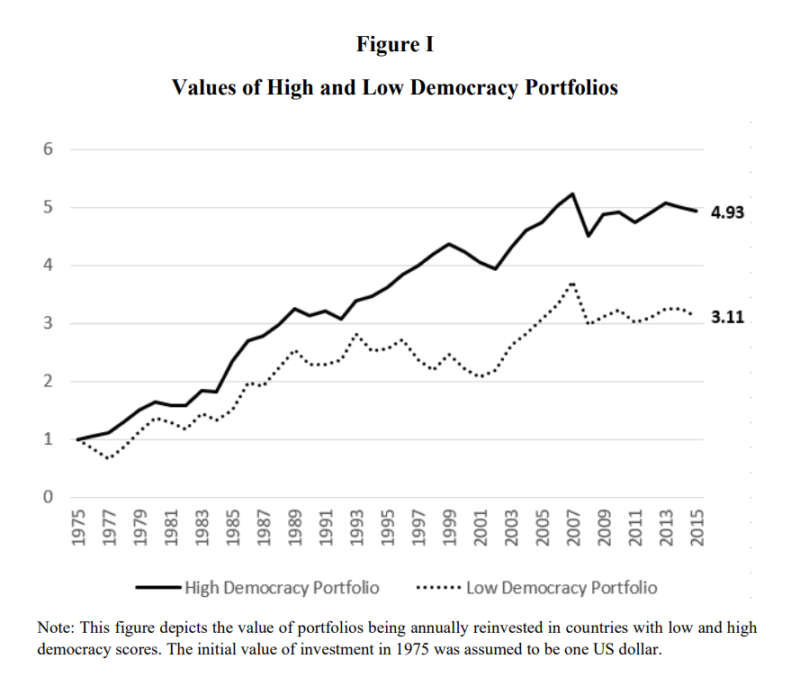
- YES. A long/short trading strategy was tested using the Democracy score. The high democracy portfolio (90th percentile or higher) and low democracy portfolio (10th percentile or lower) were constructed on an annual basis. The return on the high democracy portfolio was 9.83% and 5.29% for the low democracy portfolio. The difference in returns (4.54%) was significant, p-value = 0.0956. Although no adjustments for transactions or other trading costs were calculated, it seems a reasonable conclusion that they likely would not exceed the 4.54% difference in returns. The strength of the democracy-return association appears to offer a robust and profitable trading strategy. A nice visual from the paper:
Why does it matter?
This research provides evidence of the positive association between the level of democracy and stock returns. Stock returns are significantly higher in countries with markedly higher levels of democratization. Failing to account for the difference in returns between democracies vs. autocracies by making CAPM risk adjustments, the authors suggest an alternative explanation: the strength of investor protections. Investors in authoritarian countries are subject to an appreciably lower level of legal protection when compared to protections characteristic of mature democracies. It appears to account for the observed lower returns. While this conclusion is reasonable and even insightful, it could be challenged by the lack of sufficient risk analysis using models beyond the CAPM.
The most important chart from the paper

Abstract
This paper examines the relationship between the level of democratization and stock index returns in a sample of 74 countries. Compared with democracies, autocratic states are characterized by lower returns despite exhibiting higher return volatility. Even though this higher volatility can be mostly attributed to diversifiable country-specific risk, the Capital Asset Pricing Model is unable to explain the return differential. Instead, it is the level of investor protection that can fully account for the phenomenon described here. Autocratic leaders are reluctant to promulgate regulation shielding investors and the resultant risk of expropriation depresses the returns realized by outsiders.
About the Author: Tommi Johnsen, PhD
—
Important Disclosures
For informational and educational purposes only and should not be construed as specific investment, accounting, legal, or tax advice. Certain information is deemed to be reliable, but its accuracy and completeness cannot be guaranteed. Third party information may become outdated or otherwise superseded without notice. Neither the Securities and Exchange Commission (SEC) nor any other federal or state agency has approved, determined the accuracy, or confirmed the adequacy of this article.
The views and opinions expressed herein are those of the author and do not necessarily reflect the views of Alpha Architect, its affiliates or its employees. Our full disclosures are available here. Definitions of common statistics used in our analysis are available here (towards the bottom).
Join thousands of other readers and subscribe to our blog.