In this article, we examine what out-of-sample data from the late 1800s says about the cross-section of stock returns.
The Cross Section of Stock Returns Before 1926 (and Beyond)
- Baltussen, Guido, Van Vliet, Bart, and Van Vliet, Pim.
- Working paper , 2022
- A version of this paper can be found here
- Want to read our summaries of academic finance papers? Check out our Academic Research Insight category
What are the Research Questions?
Several studies reveal variables that predict cross-sectional differences in stock returns but mainly rely on a sample of U.S. stocks, mostly covering the post-1963 period. These studies are often criticized for potential data mining issues since the database never changes, but “new” findings crop up all the time.
This paper studies the cross-section of U.S. stock returns using a novel constructed database of out-of-sample data from 1866-1926. This ‘pre-CRSP’ sample period is of about similar length as existing CRSP-based studies (61 years), and covers an economically important period independent of existing datasets. This large new set provides new grounds for independent tests to understand stock prices and drivers of return better.
What are the Academic Insights?
The authors find:
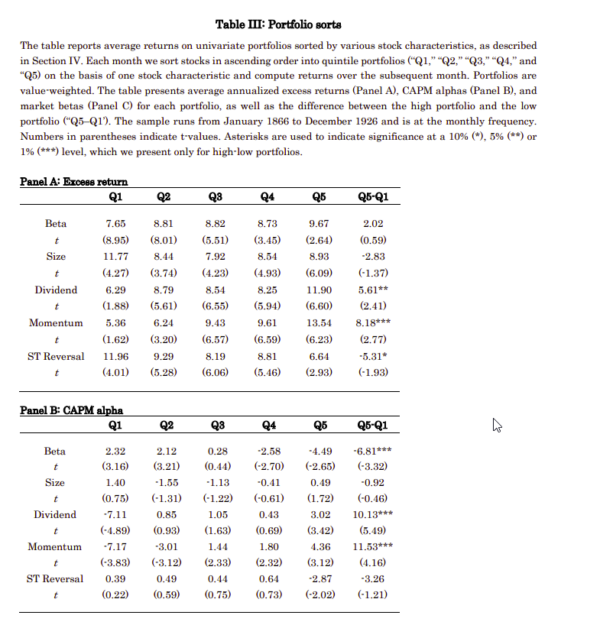
- In line with Black, Jensen and Scholes, and Fama-MacBeth we find that market beta is not priced in the cross-section, and the CAPM, on average fails to explain asset prices: low-beta stocks have positive alpha and high-beta stocks have negative alpha over the 1866-1926 sample
- Size has no significant slope in Fama-MacBeth regression and no significant return spread in portfolio sorts
- Short-term reversal is only significant in Fama-MacBeth regression tests
- Price momentum and dividend yield carry significant cross-sectional premiums or return spreads
- Combined, the six stock characteristics can explain 28% of the variation in stock returns
Why does it matter?
This study serves two main contributions: 1) the creation of a novel database covering 61-years including the major stocks traded on the U.S. exchanges during the second half of the 19th and early 20th century; 2) the examination of the cross-section of stock returns out-of-sample in a robust and rigorous way. Overall, findings on stock factors are largely similar over the pre-1926 and post-1926 era’s.
The Most Important Chart from the Paper:

Abstract
We study the cross-section of stock returns using a novel constructed database of U.S. stocks covering 61 years of additional and independent data. Our database contains data on stock prices, dividends and hand-collected market capitalizations for 1,488 major stocks between 1866-1926. Results over this ‘pre-CRSP’ era reveal a flat relation between market beta and returns, an insignificant size premium, and significant momentum, value, and low-risk premiums that are of similar size as over the post-1926 period. Overall, stock characteristics can explain over 25% of variation in stock returns. Further, recent machine learning methods are successful in predicting cross-sectional returns out-of-sample. These results show strong out-of-sample robustness of traditional factor models and novel machine learning methods.
About the Author: Elisabetta Basilico, PhD, CFA
—
Important Disclosures
For informational and educational purposes only and should not be construed as specific investment, accounting, legal, or tax advice. Certain information is deemed to be reliable, but its accuracy and completeness cannot be guaranteed. Third party information may become outdated or otherwise superseded without notice. Neither the Securities and Exchange Commission (SEC) nor any other federal or state agency has approved, determined the accuracy, or confirmed the adequacy of this article.
The views and opinions expressed herein are those of the author and do not necessarily reflect the views of Alpha Architect, its affiliates or its employees. Our full disclosures are available here. Definitions of common statistics used in our analysis are available here (towards the bottom).
Join thousands of other readers and subscribe to our blog.

