The past decade has seen a dramatic growth in sustainable investing—applying environmental, social and governance (ESG) criteria to investment strategies. Investments considered environmentally friendly are often referred to as “green,” while “brown” denotes the opposite. Important questions for investors are: What are the expected returns to green stocks? What does their past performance tell us about their future expected returns? We begin by looking at what economic theory tells us our expectations should be.
Economic Theory
While sustainable investing continues to gain in popularity, economic theory suggests that if a large enough proportion of investors choose to favor companies with high sustainability ratings and avoid those with low sustainability ratings (sin businesses), the favored company’s share prices will be elevated and the sin stock shares will be depressed. In equilibrium, the screening out of certain assets based on investors’ tastes should lead to a return premium on the screened assets.
The result is that the favored companies will have a lower cost of capital because they will trade at a higher P/E ratio. The flip side of a lower cost of capital is a lower expected return to the providers of that capital (shareholders). And the sin companies will have a higher cost of capital because they will trade at a lower P/E ratio, the flip side of which is a higher expected return to the providers of that capital.
The hypothesis is that the higher expected returns (a premium above the market’s required return) are required as compensation for the emotional cost of exposure to offensive companies. On the other hand, investors in companies with higher sustainability ratings are willing to accept the lower returns as the cost of expressing their values.
There is also a risk-based hypothesis for the sin premium. It is logical to hypothesize that companies neglecting to manage their ESG exposures could be subject to greater risk (that is, a wider range of potential outcomes) than their more ESG-focused counterparts. The argument is that companies with high sustainability scores have better risk management and better compliance standards. The stronger controls lead to fewer extreme events such as environmental disasters, fraud, corruption and litigation (and their negative consequences). The result is a reduction in tail risk in high-scoring firms relative to the lowest-scoring firms. The greater tail risk creates the sin premium.
Lubos Pastor, Robert Stambaugh and Lucian Taylor sought the answers to the questions about the expected returns to green stocks and their future expected returns based on past performance in their study “Dissecting Green Returns,” published in the November 2022 issue of the Journal of Financial Economics. This paper is a follow-up to their 2019 study “Sustainable Investing in Equilibrium,” which found:
- Investors differ in their preferences for sustainability, or ESG preferences. These preferences have two dimensions. First, agents derive utility from holdings of green firms and disutility from holdings of brown firms. Second, though they care about firms’ aggregate social impact, they also care about financial wealth. However, they are willing to sacrifice some expected return in exchange for the utility benefits provided by green investing.
- Investors’ taste for green holdings affects asset prices—the greener the asset, the lower its CAPM alpha in equilibrium. Green assets have negative alphas and brown assets have positive alphas. Consequently, agents with stronger ESG preferences, whose portfolios tilt more toward green assets and away from brown assets, earn lower expected returns.
- If ESG concerns strengthen unexpectedly, green assets can outperform brown assets despite having lower expected returns. The higher short-term returns are a result of the increased demand for the stocks of green firms on valuations. “Exposure to ESG risk is why green assets may outperform brown assets over a period of time.” Investor tastes/preferences can drive short-term returns through changes in valuations. Thus, the premium induced by exposure to the ESG risk factor can be large enough to overcome green stocks’ negative alphas.
- The authors claimed there is an ESG risk factor, as the strength of ESG concerns is time varying, both for investors in firms’ shares and for the customers who buy the firms’ goods and services. If ESG concerns strengthen, customers may shift their demand for goods and services to greener providers (the customer channel), and investors may derive more utility from holding the stocks of greener firms (the investor channel). Greener stocks are more exposed to the ESG risk factor.
Their new paper began by noting that green assets had delivered higher returns in recent years. They then explained that they estimated expected returns in two ways: ex ante, using implied costs of capital, and ex post, using realized returns purged of shocks from climate concerns and earnings. Using environmental ratings from MSCI, they assigned greenness measures to individual U.S. stocks. And to measure concerns about climate change, they used the Media Climate Change Concerns (MCCC) index, constructed by using data from eight major U.S. newspapers. Their sample covered the period November 2012-December 2020. Following is a summary of their findings:
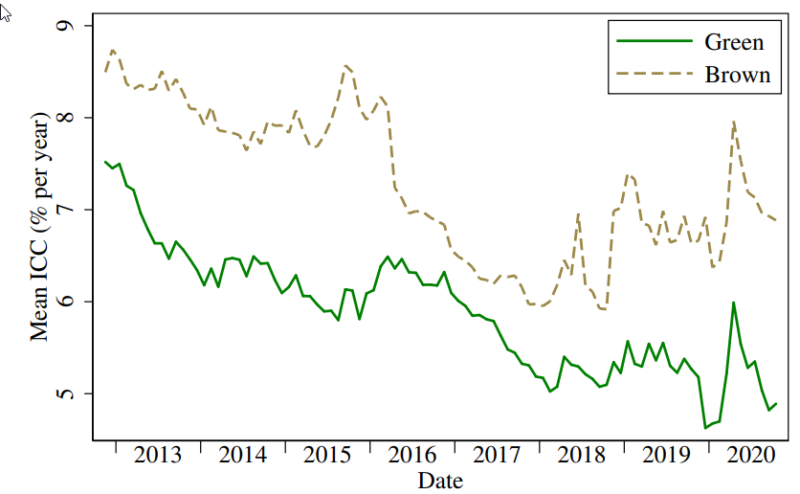
- Over the sample period, the green portfolio’s internal cost of capital (ICC) declined from 7.6 percent to 4.9 percent per year (a fall of 2.7 percentage points, and a relative decline of 36 percent), whereas the brown portfolio’s ICC fell from 8.8 percent to 6.8 percent per year (a fall of 2 percentage points, and a relative decline of 23 percent). Importantly, at each point in time, the green portfolio’s ICC was below that of the brown portfolio, indicating a consistently negative equity greenium—lower expected return on green stocks versus brown.
Over the sample period, the value-weighted portfolio of stocks in the top third of greenness outperformed the bottom third by a cumulative return difference of 174 percent; and the return spread, GMB (green-minus-brown), had a monthly Sharpe ratio of 0.33, larger than the stock market’s Sharpe ratio. The strong performance of GMB could not be explained by exposures to return factors prominent in the asset pricing literature.
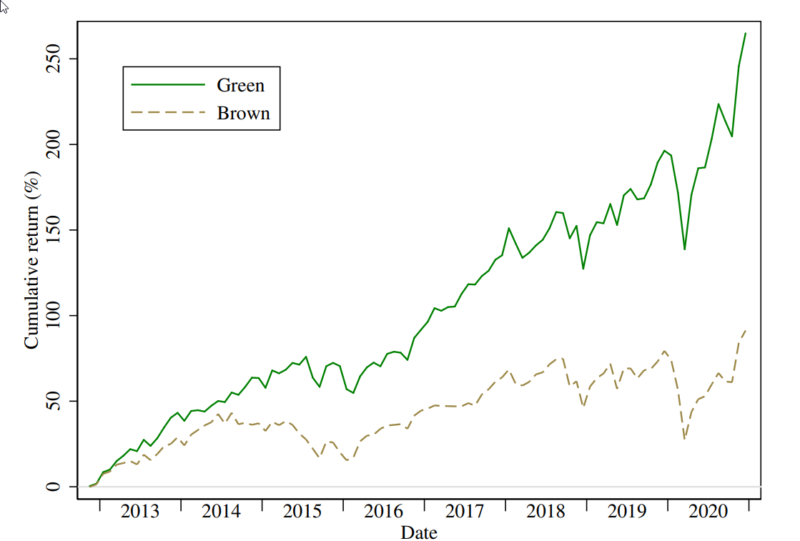
Returns on value-weighted green and brown portfolios. This figure plots the green and brown portfolios’ cumulative returns. The values of the green and brown lines at the end of 2020 are 264.9 and 91.3, implying green stocks outperformed brown by 264.9 − 91.3 = 174 percentage points over this period.
- While green assets delivered high returns in recent years, that performance reflected unexpectedly strong increases in environmental concerns, not high expected returns—their level of the measure of environmental concerns nearly doubled.
- Green stocks tended to be large stocks, growth stocks and recent winners.
- German green bonds outperformed their higher-yielding non-green twins because the “greenium” (the difference in yield between German green and non-green bonds) widened—since issuance, the 10-year greenium experienced almost a fourfold widening. Given the now-wider greenium, German green bonds should be expected to underperform going forward.
- U.S. green stocks outperformed brown as climate concerns strengthened. The results were not driven by big tech stocks (such as the FAANGs).
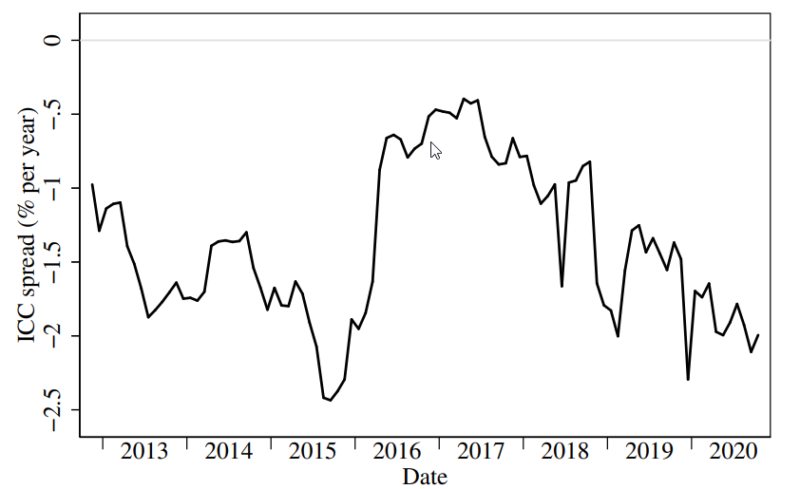
- Consistent with economic theory, green stocks had lower expected returns than brown stocks—there was a consistently negative equity greenium throughout the sample period. Thus, setting climate shocks to zero, green stocks would have underperformed. The chart below shows the differences in the implied cost of capital between green and brown stocks. Note the steep decline from 2017 through 2020 (which coincides with a historic drawdown for value stocks).
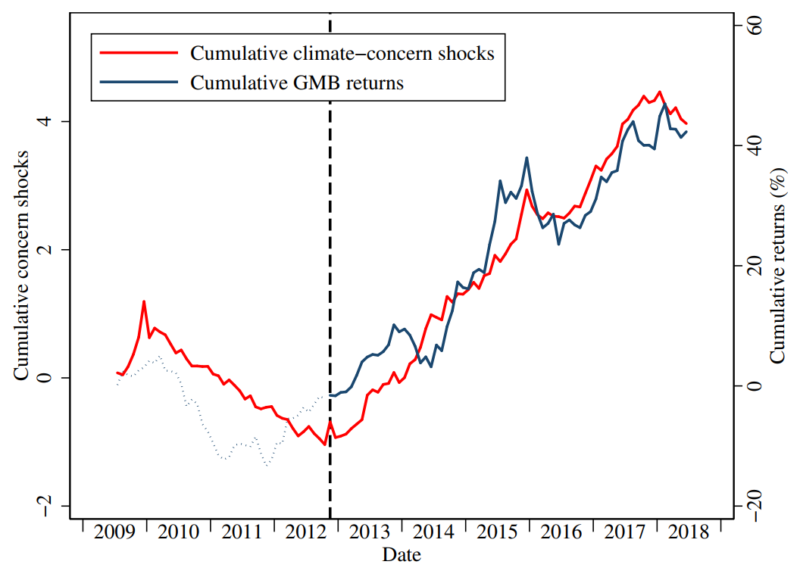
Shocks to climate concerns exhibited a significant positive relation to GMB—green stocks tended to outperform brown when there was bad news about climate change, consistent with green stocks being better hedges against climate shocks.
- Industry-level greenness, as opposed to within-industry differences in greenness, largely accounts for the superior performance of green stocks as well as the importance of climate shocks in explaining that performance.
- While large-cap GMB responded mostly to same-month shocks, consistent with prior contrarian investing research showing that small stocks react more slowly in general, small stocks reacted to climate news with a delay.
- Outperformance caused by the strengthening of investor concerns is followed by lower expected performance of GMB going forward—a shift in GMB’s expected future performance relates inversely to its realized performance.
- A theoretically motivated green factor explains much of value stocks’ recent underperformance—the green factor and value (HML) were negatively correlated, as value stocks are more often brown than green. It also helps explain momentum positive performance over the same period.
Pastor, Stambaugh and Taylor concluded that their findings “underline the danger in using recent average returns to estimate expected returns. In particular, the recent outperformance of green assets does not imply high green returns going forward. In fact, if the outperformance resulted from increased demands by ESG investors, then green assets’ expected returns are lower today than a decade ago. In the same spirit, value stocks’ recent underperformance is less likely to continue, because value stocks tend to be brown and growth stocks green. From the corporate finance perspective, our findings imply that greener firms have lower costs of capital than their recent stock performance might suggest. This is good news for ESG investors, because one way they exert social impact is by decreasing green firms’ cost of capital.”
Investor Takeaways
One of the most common errors made by investors results from recency bias—the tendency for people to overweight new information or events without considering the objective probabilities of those events over the long run. Recency bias can lead investors to believe that green stocks have higher forward-looking returns. However, the failure to account for the unexpectedly high returns on stocks that appear to be good climate hedges can lead investors to believe that stocks providing better climate hedging have higher expected returns, not lower as theory predicts (hedges are insurance and thus should have lower expected returns). Pastor, Stambaugh and Taylor’s findings also provided good news for value investors, as much of their underperformance can be explained by an increasing greenium, leading to higher expected returns for value stocks.
Larry Swedroe is the head of financial and economic research at Buckingham Wealth Partners.
Disclosures
For informational and educational purposes only and should not be construed as specific investment, accounting, legal, or tax advice. Neither the Securities and Exchange Commission (SEC) nor any other federal or state agency have approved, determined the accuracy, or confirmed adequacy of this article. Information may be based on third party data which may become outdated or otherwise superseded without notice. Third party information is deemed to be reliable, but its accuracy and completeness cannot be guaranteed. By clicking on any of the links above, you acknowledge that they are solely for your convenience, and do not necessarily imply any affiliations, sponsorships, endorsements or representations whatsoever by us regarding third-party websites. We are not responsible for the content, availability or privacy policies of these sites, and shall not be responsible or liable for any information, opinions, advice, products or services available on or through them. Indices are not available for direct investment. Their performance does not reflect the expenses associated with the management of an actual portfolio nor do indices represent results of actual trading. Information from sources deemed reliable, but its accuracy cannot be guaranteed. Performance is historical and does not guarantee future results. All investments involve risk, including loss of principal. The opinions expressed here are their own and may not accurately reflect those of Buckingham Strategic Wealth® or Buckingham Strategic Partners®, collectively Buckingham Wealth Partners. LSR-22-405
About the Author: Larry Swedroe
—
Important Disclosures
For informational and educational purposes only and should not be construed as specific investment, accounting, legal, or tax advice. Certain information is deemed to be reliable, but its accuracy and completeness cannot be guaranteed. Third party information may become outdated or otherwise superseded without notice. Neither the Securities and Exchange Commission (SEC) nor any other federal or state agency has approved, determined the accuracy, or confirmed the adequacy of this article.
The views and opinions expressed herein are those of the author and do not necessarily reflect the views of Alpha Architect, its affiliates or its employees. Our full disclosures are available here. Definitions of common statistics used in our analysis are available here (towards the bottom).
Join thousands of other readers and subscribe to our blog.