The size effect was first documented by Rolf Banz in his 1981 paper “The Relationship Between Return and Market Value of Common Stocks,” which was published in the Journal of Financial Economics. After the 1992 publication of Eugene Fama and Kenneth French’s paper “The Cross-Section of Expected Stock Returns,” the size effect was incorporated into what became finance’s new workhorse asset-pricing model, the Fama-French three-factor model (adding value and size to the CAPM’s market beta). Unfortunately, the size premium basically disappeared in the United States after the publication of Banz’s work.
Cliff Asness, Andrea Frazzini, Ronen Israel, Tobias Moskowitz and Lasse Pedersen, authors of the January 2015 paper “Size Matters, If You Control Your Junk,” examined the problem of the disappearing size premium by controlling for the quality factor (QMJ, quality minus junk). They noted: “Stocks with very poor quality (i.e., ‘junk’) are typically very small, have low average returns, and are typically distressed and illiquid securities. These characteristics drive the strong negative relation between size and quality and the returns of these junk stocks chiefly explain the sporadic performance of the size premium and the challenges that have been hurled at it.” They added: “Small quality stocks outperform large quality stocks and small junk stocks outperform large junk stocks, but the standard size effect suffers from a size-quality composition effect.” In other words, controlling for quality restores the size premium.
Ron Alquist, Ronen Israel and Tobias Moskowitz also examined the impact of quality on the size effect in their 2018 paper, “Fact, Fiction, and the Size Effect.” They found: “Controlling for quality resurrects the size effect after the 1980s and explains its time variation, restores a linear relationship between size and average returns that is no longer concentrated among the tiniest firms, revives the returns to size outside of January and simultaneously diminishes the returns to size in January—making it more uniform across months of the year, and uncovers a larger size effect in almost two dozen international equity markets, 30 where size has been notably weak. These results are robust to using non-market-based size measures, making the size premium a much stronger and more reliable effect after controlling for quality.”
New Evidence
Marc Simpson and Axel Grossmann contribute to the literature on the size premium with their September 2022 study, “The Resurrected Size Effect Still Sleeps in the (Monetary) Winter,” in which they investigated the size effect by further bifurcating subperiods into periods of monetary easing and monetary tightening. Their classification scheme for determining the Fed’s policy “Stance” was represented by changes in the Fed’s discount rate, while “Stringency” was associated with changes in the effective federal funds rate. Stance and Stringency were assumed to remain in the same classification until the direction of change was reversed. When either Stance or Stringency indicated a restrictive environment, they classified the period as one of monetary tightening. When both Stance or Stringency indicated a loosening, they classified the period as one of monetary easing.
Simpson and Grossman controlled for several variables that the literature relates to the size effect, including quality, liquidity and business cycle troughs. Trough periods were based on the trough month in the business cycle, identified by the National Bureau of Economic Research (NBER), plus the three months preceding it and the three months following it. In their time series regressions, they used the following factors: beta (RMRF), size (SMB), value (HML), momentum (UMD), profitability (RMW), investment (CMA), betting against beta (BAB), quality minus junk (QMJ) and liquidity (LIQ). Their main factor portfolio returns covered the period August 1954-December 2021. However, due to data availability, the models including the Fama and French RMW factor and the CMA factor covered the period July 1963-December 2021, while the model including the LIQ factor covered the period July 1963-December 2020. Following is a summary of their findings:
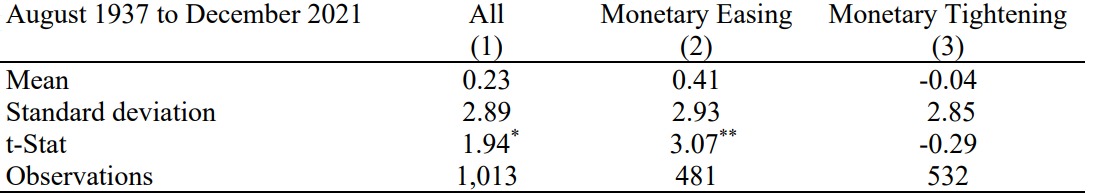
- Over the period August 1937-December 2021, there was a statistically significant (at the 5 percent confidence level) monthly size premium of 0.23 percent.
- The size premium was much stronger during periods of monetary easing—a statistically significant 0.41 percent per month at the 1 percent confidence level. However, it disappeared entirely during periods of monetary tightening.
Table 2: Unconditional Monthly Mean of SMB, using Discount Rate to determine Monetary Condition. 1937 to 2021 The table reports the monthly means, standard deviation, and t-statistics for the Fama French (1993) size factor (SMB) over the period from August 1937 to December 2021 for the entire sample (column 1) as well as across the states of monetary easing (column 2) and monetary tightening (column 3). Monetary states are determined solely by the Fed’s Discount Rate. **, * Indicates statistical significance at the 1% and 5% levels, respectively. Returns are in percentages.
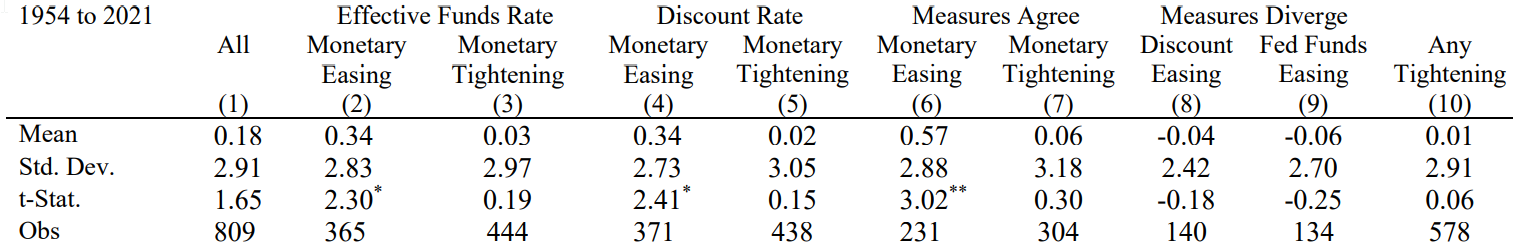
As shown in Table 3 below, over the period 1954-2021, when both monetary measures were in agreement that policy was easing, the size premium increased to a statistically significant (at the 5 percent confidence level) 0.57 percent per month. Conversely, the premium was not significant (it basically disappeared) when either measure of monetary policy signaled tightening.
Table 3: Unconditional Monthly Mean of SMB, 1954 to 2021, and subperiods. The table reports the monthly means, standard deviation, and t-statistics for the Fama French (1993) size factor (SMB) over the entire period from August 1954 to December 2021.The monetary states are either determined by the Fed’s Funds rate (effective fund rate), the Fed’s Discount Rate (Discount Rate), a measure where both rates agree (measures agree), or a measure where both rates diverged (measures diverge). In the case of “measures agree” monetary easing is classified as the period where both rates indicate a loosening environment and monetary tightening is classified as the period where both rates indicate a restrictive environment. In the case of “measures diverge”, discount easing or fed funds easing define the remaining periods where only one of the two rates indicate a loosening environment. Finally, any tightening defines the periods where either the Fed’s Discount Rate or the Fed’s Funds rate indicate a restrictive environment. Returns are in percentages.
- The size effect was present during periods of monetary expansion whether or not controlling for quality, and it was dormant in periods of monetary tightening even after controlling for firm quality.
- The size effect was not only present during business cycle troughs but was present in monetary easing periods outside of trough periods.
- Figure 1 below plots the cumulative SMB returns during easing and tightening periods from 1969 through 2021. The highest performance was achieved by the strategy that invested in the size premium only during periods of monetary easing, followed by the strategy that invested only in business cycle troughs. While 70 percent of the trough periods were also easing periods, only 20 percent of the easing periods were trough periods. The authors explained: “Given the differences in the plots, one can deduce that there is a positive relation between easing periods and the SMB that goes beyond being at the trough of the business cycle.”
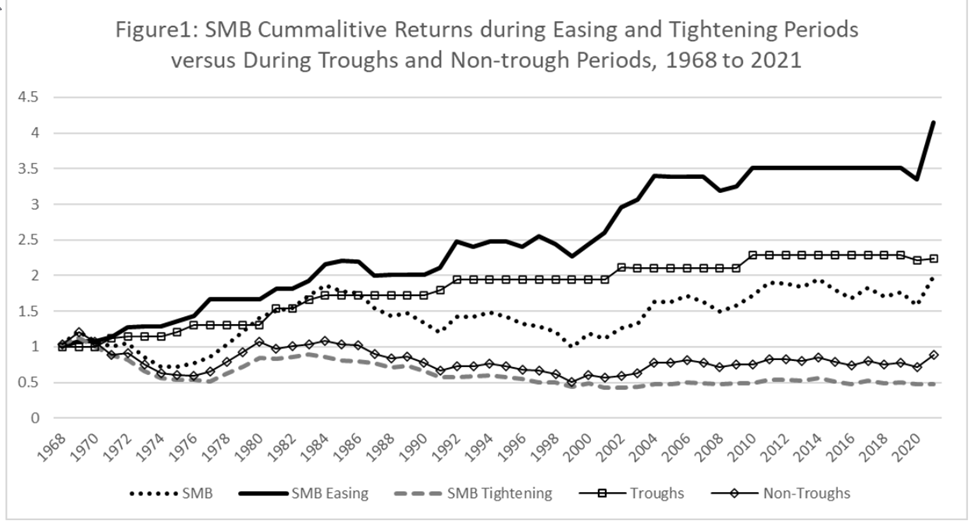
Figure 1 plots the performance of $1.00 invested in each of five strategies in December 1967. One strategy invests in the SMB, a second strategy invests in the SMB only during easing periods, a third strategy invests in the SMB only during tightening periods, a fourth strategy invests in the SMB only during troughs in the business cycle, while the fifth strategy invests in the SMB during non-trough periods.
- Regressing the size factor, SMB, on seven standard asset pricing factors used in the literature, there were positive, significant alphas during periods of monetary easing but never significant alphas in monetary tightening periods.
Simpson and Grossman noted that the literature suggests that among the channels that easing monetary policy is likely to influence small firms differently than large firms are: a stock market liquidity effect (when monetary policy becomes expansive, funding conditions improve, liquidity increases in the entire market, and the premium for holding illiquid smaller stocks decreases); a firm-level, balance sheet, liquidity effect (small firms benefit more from greater access to funds during monetary easing periods than do large firms); and increased access to credit (monetary tightening periods disproportionately impact credit flows to small firms as compared to large firms). They noted: “If the market anticipates an improvement in credit market conditions as the central bank moves from a restrictive to an expansionary policy state, the prices of small stocks will rebound more rapidly than those of large stocks. The significant, positive performance of the SMB strategy detected during easing monetary policy states is influenced by the greater sensitivity of small stocks to changing credit market conditions.” They also found that stock market liquidity could not explain a large amount of the size premium during monetary easing periods, and therefore it was more likely that ease of access to capital might be responsible for the improved performance of small firms relative to large firms in these periods.
Their findings led Simpson and Grossmann to conclude: “Investors seeking to capture this premium would be well served to consider the Fed’s policy stance and the stringency with which the Fed is pursuing its policy.”
Investor Takeaways
Given that tightening monetary policy increases economic risks, Simpson and Grossman provided compelling evidence of a risk explanation for the size factor. For those investors who engage in tactical asset allocation strategies (market timing), their evidence suggests that it might be possible to exploit the information. Before jumping to that conclusion, I would caution that because markets are forward-looking, they should anticipate periods of Fed tightening and the heightened risks of small stocks. In addition, the research, including the 2015 studies “When Anomalies Are Publicized Broadly, Do Institutions Trade Accordingly?” and “Does Academic Research Destroy Stock Return Predictability?” and the 2016 study “Anomalies Across the Globe: Once Public, No Longer Existent?,” has found that post-publication of research findings institutions (especially hedge funds) trade to exploit findings and premiums shrink significantly. In other words, with the publication of their work, Simpson and Grossman may have spoiled the game. I would add that the heightened risks of small stocks could already be in current valuations. For example, as of the end of September 2022, Morningstar shows that the large-cap iShares Russell 1000 ETF (IWB) had a P/E of 16.9 while the small-cap iShares Russell 2000 ETF (IWM) had a P/E of just 11.6. In other words, large caps are currently trading about 46 percent more expensive than small caps. Valuations do matter. Forewarned is forearmed.
Larry Swedroe is head of financial and economic research for Buckingham Wealth Partners.
Disclosures
For informational and educational purposes only and should not be construed as specific investment, accounting, legal, or tax advice. Certain information is based upon third party information and may become outdated or otherwise superseded without notice. Third party information is deemed to be reliable, but its accuracy and completeness cannot be guaranteed. By clicking on any of the links above, you acknowledge that they are solely for your convenience, and do not necessarily imply any affiliations, sponsorships, endorsements or representations whatsoever by us regarding third-party websites. We are not responsible for the content, availability or privacy policies of these sites, and shall not be responsible or liable for any information, opinions, advice, products or services available on or through them. The opinions expressed by featured authors are their own and may not accurately reflect those of Buckingham Strategic Wealth® or Buckingham Strategic Partners®, collectively Buckingham Wealth Partners. Neither the Securities and Exchange Commission (SEC) nor any other federal or state agency have approved, determined the accuracy, or confirmed the adequacy of this article. LSR-22-404
About the Author: Larry Swedroe
—
Important Disclosures
For informational and educational purposes only and should not be construed as specific investment, accounting, legal, or tax advice. Certain information is deemed to be reliable, but its accuracy and completeness cannot be guaranteed. Third party information may become outdated or otherwise superseded without notice. Neither the Securities and Exchange Commission (SEC) nor any other federal or state agency has approved, determined the accuracy, or confirmed the adequacy of this article.
The views and opinions expressed herein are those of the author and do not necessarily reflect the views of Alpha Architect, its affiliates or its employees. Our full disclosures are available here. Definitions of common statistics used in our analysis are available here (towards the bottom).
Join thousands of other readers and subscribe to our blog.