The year 2022 was a difficult one for investors in traditional 60/40 portfolios, as equities all around the globe and bonds produced double-digit losses, a very rare event. Can factor strategies mitigate risk? That performance has heightened interest in the diversification benefits of factor-based strategies.
Redouane Elkamhi, Jacky Lee and Marco Salerno contribute to the literature with their study “Financial Anomalies in Asset Allocation: Risk Mitigation with Cross-Sectional Equity Strategies,” published in the November 2022 issue of The Journal of Portfolio Management, in which they examined how financial anomalies in the cross-section of equity returns performed in different economic regimes. Their focus was on recessions defined by the NBER and inflationary times defined as periods when the year-over-year realized inflation rate was rising and reached a level of at least 5%. These are times of the greatest concerns to investors. They then examined how adding financial anomalies contributed to various monthly rebalanced portfolios (60/40 portfolio of equities—the value-weighted returns across all firms listed on the NYSE, AMEX or Nasdaq and 10-year Treasuries; a risk parity portfolio; an all-equity portfolio; and a portfolio of 55% equities, 35% fixed income and 10% commodities). Anomalies are of interest because they are unique sources of risk (have low correlation with traditional assets) that can provide diversification benefits.
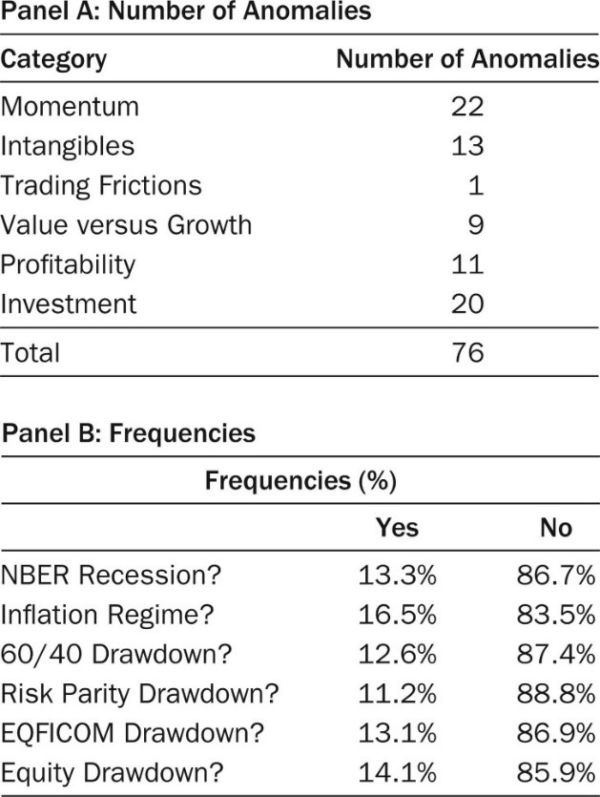
Elkamhi, Lee and Salerno grouped the 76 anomalies they studied into five categories according to the classification provided by the authors of the study “Replicating Anomalies”: cross-sectional momentum, intangibles, value versus growth, profitability, and investment. They then analyzed their performance using value-weighted portfolios and NYSE breakpoints. They chose not to include trading frictions because there was only one anomaly, and trading frictions anomalies often fail to replicate once researchers account for value-weighted returns and NYSE breakpoints.

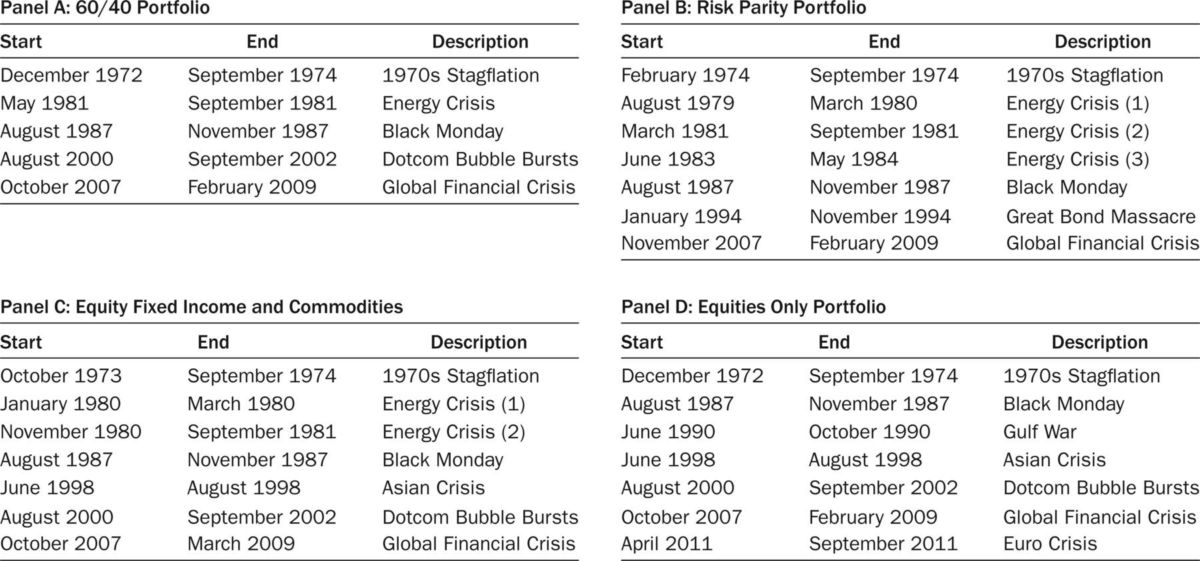
They defined drawdowns as periods of losses in excess of 10%. Their data sample covered the period 1971-2019. The following exhibit provides the start and end dates for all the drawdowns considered:

Following is a summary of their key findings:
- All anomalies had positive monthly average returns—an unsurprising result because they chose financial anomalies that had statistical significance.
- Profitability anomalies exhibited a strong and consistent countercyclical behavior with respect to periods of large drawdowns for traditional portfolios.
- The financial anomalies considered had not historically provided a hedge against inflationary times, with the exception of the cross-sectional momentum category. They also found that the cross-sectional dispersion of the anomalies within each category became larger during times of high inflation and periods of portfolio drawdown. Financial anomalies are not particularly attractive as an inflation-hedging strategy, with the exception of cross-sectional momentum.
- Profitability consistently delivered positive returns in all drawdown periods across the four traditional portfolios considered in this study (60/40; risk parity; portfolio of equities, fixed income and commodities; and an all-equity portfolio). That is, for every historical drawdown period of each of the four portfolios, profitability always delivered positive returns, whereas the other four categories of anomalies had at least one instance in which returns were negative.
- Value versus growth anomalies also provided good performance, albeit with a wider dispersion of outcomes when compared to the profitability category and a weaker performance during good times.
- The investment anomaly performed well during recessions. The category offered some benefits to all the portfolios except the risk parity portfolio.
- The performance of the intangibles category in portfolios was mixed.
- Momentum anomalies showed wide dispersion with negative skewness in returns (except during inflationary regimes, when returns were positively skewed), while the intangibles and profitability anomaly categories had wide dispersions but skewed toward more positive returns.
- All anomaly categories had a wide dispersion of returns during drawdown periods—when markets were underperforming, the performance of individual financial anomalies was more disperse and uncertain—highlighting the need to build a diversified anomaly portfolio.
- Adding financial anomalies to traditional portfolios increased the Sharpe ratio of the overall portfolio—all five anomalies studied in this article helped various kinds of traditional portfolios; the profitability and investment anomalies helped traditional portfolios the most in terms of protection from drawdowns.
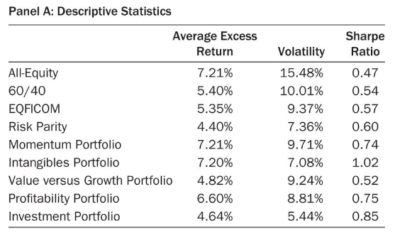
The following exhibit provides the total return of the four benchmark portfolios and the five anomaly portfolios:

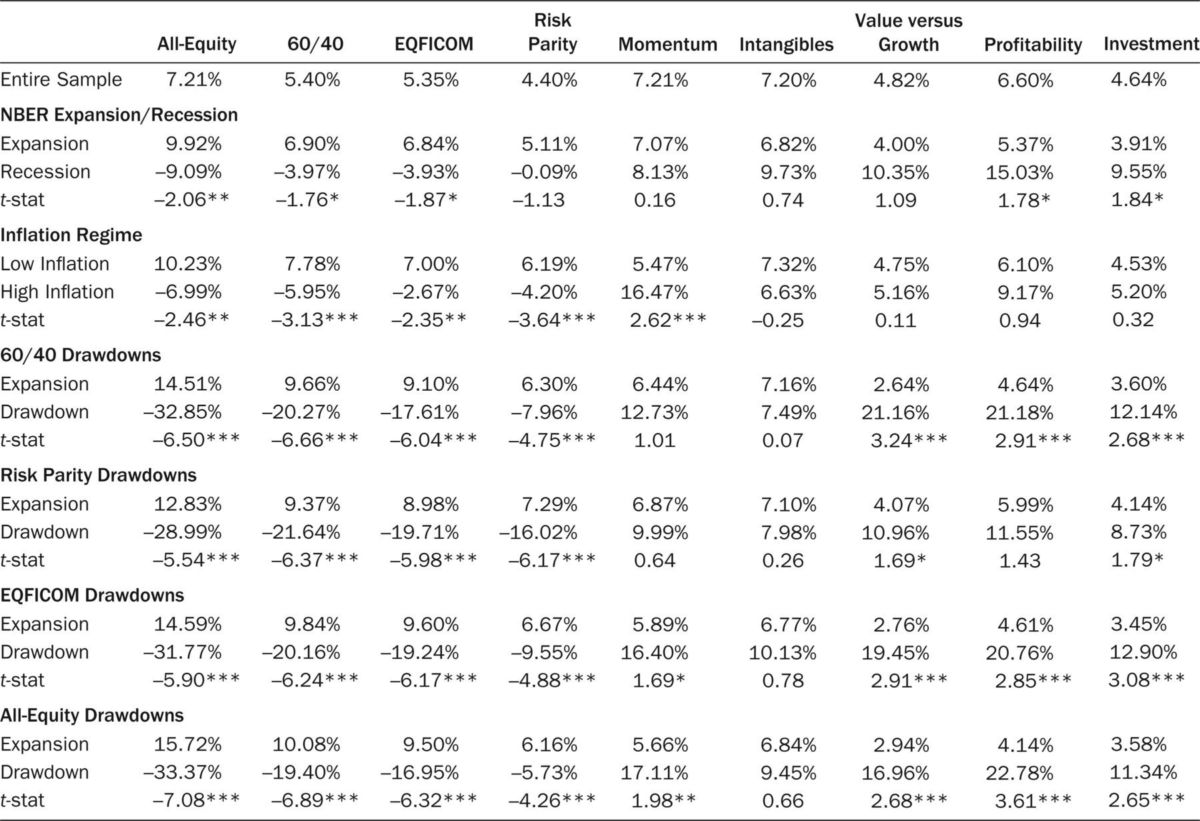
The next exhibit shows the performance of the traditional portfolios and the portfolios of anomalies across different regimes: NBER recessions/expansions, inflationary regimes, and periods of large drawdowns for traditional portfolios. It shows that profitability, investment, and value versus growth are the three categories that performed well when traditional portfolios were experiencing large drawdowns. Excess returns of these anomalies were positive during the bad state for traditional portfolios. In most cases the difference in average excess returns between good and bad states was statistically significant.

The results are hypothetical results and are NOT an indicator of future results and do NOT represent returns that any investor actually attained. Indexes are unmanaged and do not reflect management or trading fees, and one cannot invest directly in an index.
Their findings led Elkamhi, Lee and Salerno to conclude: “Financial anomalies can be a valuable tool in the arsenal of asset managers to build robust and well-diversified portfolios.” They added: “Financial anomalies allow investors to harvest risk premiums, making them even more attractive in today’s environment of low interest rates. … Given the benefits that financial anomalies can provide to a portfolio … investors that have diversified portfolios of equities and bonds can benefit from including portfolios of anomalies in their asset allocation.”
Elkamhi, Lee and Salerno’s findings are consistent with those of the authors of the study “Investing in Deflation, Inflation, and Stagflation Regimes,” who examined asset class and factor premiums across inflationary regimes in key developed markets over periods starting as early as 1875 and ending in 2021. They concluded: “Overall, we can conclude that the most severe bad times for investors in traditional asset classes are times of high inflation with either economic or earnings downturns, rising rates, falling equity markets, or rising inflation, or deflationary bear markets, and factor premiums on average help to alleviate the pain during these periods.”
They are also consistent with those of the authors of the 2018 study “Tail Behavior in Portfolio Optimization for Equity Style Factors,” who examined the performance of the five Fama-French factors (market beta, size, value, investment and profitability)—as well as momentum—to determine how these factors behaved in the tail of their distribution. They concluded: “Our results indicate that Fama-French factors offer diversification benefits during periods when market experiences losses. As a consequence, they comprise a useful source of information when we wish to optimize the asset allocation of our portfolio.” And they are also generally consistent with the findings of the authors of the 2021 study “The Best Strategies for Inflationary Times.”
Investor Takeaways
Traditional portfolios such as 60% equity/40% bonds concentrate the vast majority of their risk in one single factor: market beta. In addition, stock and bond correlations are time-varying/regime dependent. As investors were reminded in 2022, their correlations, while averaging about zero over the long term, can turn sharply positive at the worst time, leading to large portfolio drawdowns. Financial advisors and investors have a large body of evidence demonstrating that adding the unique risks of factor strategies has historically improved portfolio efficiency and reduced the size of drawdowns (which can help investors stay disciplined, avoiding panicked selling). My book, co-authored with Kevin Grogan, “Reducing the Risk of Black Swans” demonstrates those benefits and shows how factor strategies have improved outcomes by reducing tail risk without sacrificing returns.
Larry Swedroe is head of financial and economic research for Buckingham Wealth Partners.
For informational and educational purposes only and should not be construed as specific investment, accounting, legal, or tax advice. Certain information is based on third party data which may become outdated or otherwise superseded without notice. Third party data is deemed to be reliable, but its accuracy and completeness cannot be guaranteed. Neither the Securities and Exchange Commission (SEC) nor any other federal or state agency have approved, determined the accuracy, or confirmed adequacy of this article. By clicking on any of the links above, you acknowledge that they are solely for your convenience, and do not necessarily imply any affiliations, sponsorships, endorsements or representations whatsoever by us regarding third-party websites. We are not responsible for the content, availability or privacy policies of these sites, and shall not be responsible or liable for any information, opinions, advice, products or services available on or through them. The opinions expressed here are their own and may not accurately reflect those of Buckingham Strategic Wealth® or its affiliates. LSR-22-427
About the Author: Larry Swedroe
—
Important Disclosures
For informational and educational purposes only and should not be construed as specific investment, accounting, legal, or tax advice. Certain information is deemed to be reliable, but its accuracy and completeness cannot be guaranteed. Third party information may become outdated or otherwise superseded without notice. Neither the Securities and Exchange Commission (SEC) nor any other federal or state agency has approved, determined the accuracy, or confirmed the adequacy of this article.
The views and opinions expressed herein are those of the author and do not necessarily reflect the views of Alpha Architect, its affiliates or its employees. Our full disclosures are available here. Definitions of common statistics used in our analysis are available here (towards the bottom).
Join thousands of other readers and subscribe to our blog.

