Traditional value strategies use common valuation metrics, such as book-to-market (B/M), price-to-earnings (P/E), price-to-sales (P/S) or price-to-cash flow (P/CF), to establish a ratio between a market value and a fundamental anchor to assess the cheapness of a stock. The largest historical drawdown for traditional value strategies over the period November 2016-October 2020 raised the question of whether there was something wrong with the traditional factor. Specifically, the question raised was whether intangible assets, such as patents and proprietary software, are properly treated in valuing a company. Is there something wrong with using traditional value factors to evaluate intangible assets?
The ability to interpret financial statements has been complicated by the dramatic shift from tangible investments (such as plant and equipment) to intangible investments (such as research and development, advertising and expenses related to human capital). The increasing role of intangibles is highlighted by the fact that research and development (R&D) expenditures increased from 1.0% of company expenditures in 1975 to 7.5% in 2018. And in 2015, services’ share of GDP stood at 74% in high-income countries and just under 69% globally.
Under U.S. generally accepted accounting principles (GAAP), internally generated intangible assets (such as patents, copyrights, intellectual property and brands) are typically expensed on the income statement when incurred. The assets are not reported on the balance sheet, and instead of being added to book value, the costs of the intangibles are subtracted from book value. This distinction is primarily due to the higher uncertainty around the potential of those intangibles to provide future benefits and the difficulty of identifying and objectively measuring such benefits. However, when obtained through mergers or acquisitions, internally developed intangibles of acquirees generally are recognized at their fair value (the acquirer had set the value) on the balance sheet as externally acquired intangibles.
Aside from the U.S., almost all developed and emerging market countries now follow International Financial Reporting Standards (IFRS), with China and India being two major exceptions. And in Japan only 60% of companies follow IFRS, 30% follow local GAAP, and 10% follow U.S. GAAP. Under IFRS, research expenditures are expensed on the income statement and development expenditures are capitalized on the balance sheet if certain conditions are met. As a result, international firms tend to report higher levels of internally generated intangibles on their balance sheets. In certain countries (e.g., the U.K.), that was true prior to the adoption of IFRS.
Given the shift in expenditures, it’s not surprising that researchers, including the authors of the 2020 studies “Explaining the Recent Failure of Value Investing,” “Intangible Capital and the Value Factor: Has Your Value Definition Just Expired?” and “Equity Investing in the Age of Intangibles”; the 2021 study “Value of Internally Generated Intangible Capital”; and the 2022 study “Intangibles: The Missing Ingredient in Book Value,” have focused attention on the impact on equity valuations and returns resulting from the change in the relative importance of intangible assets compared to physical assets.
The authors of those studies found that the increasing importance of intangibles, at least for industries with high concentrations (such as health care and technology), plays an important role in the cross-section of returns. Thus, the role of intangibles should be addressed in portfolio construction because not accounting for them affects value metrics and other measures (e.g., profitability) that often scale by book value or total assets, both of which are affected by intangibles. One solution recommended and used by some investment management firms is to capitalize the investments on the income statement and amortize them over their useful lives, thereby treating an intangible investment the same as a tangible investment.
New Research
Stefan Vincenz contributes to the literature on intangibles with his February 2023 study, “Intangible Value: An International Perspective,” in which he constructed an intangible-adjusted value factor, HMLINT, in the U.S., Europe, Japan, and Asia Pacific (ex-Japan). To value intangibles, he used a perpetual inventory method also used in prior research. The construction of HMLINT closely followed the methodology of Fama and French’s value factor but added a proxy for intangible assets and subtracted goodwill from book value. His data sample spanned the period June 1983-December 2021. Here is a summary of his key findings:
- The HMLINT factor was highly correlated with the traditional value factor (75%, 83%, 71%, and 96% in the U.S., Europe, Japan, and Asia Pacific, respectively).
- When adjusting a company’s book value by internally generated intangible assets, sorting on the resulting (intangible-adjusted) book-to-market ratio delivered significantly improved performance over the traditional value factor in multiple international regions.
- Over the entire sample and across all regions, the returns of HMLINT were significantly more positive than those of HML. HMLINT also outperformed HML in all regions on a risk-adjusted basis. Moreover, it experienced less extreme drawdowns than HML across all presented regions.
Table 1
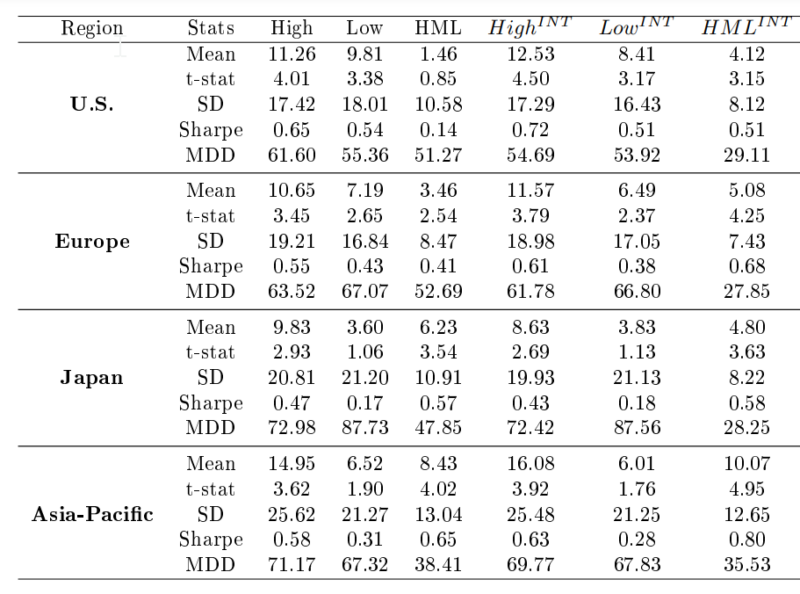
The results are hypothetical results and are NOT an indicator of future results and do NOT represent returns that any investor actually attained. Indexes are unmanaged and do not reflect management or trading fees, and one cannot invest directly in an index.
In the more recent period from 2007 onwards, the outperformance of intangible value over the traditional value factor was significantly positive in all regions, including Japan.
Figure 2
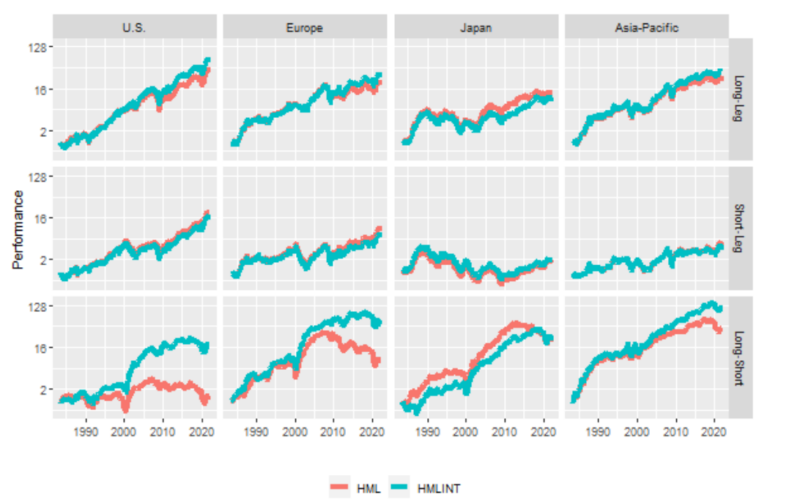
The results are hypothetical results and are NOT an indicator of future results and do NOT represent returns that any investor actually attained. Indexes are unmanaged and do not reflect management or trading fees, and one cannot invest directly in an index.
- With regional exceptions, the intangible value factor loaded significantly positive (besides HML) on the size, profitability and investment factors. Additionally, intangible value loaded negatively on momentum. The spanning regressions showed how the intangible value factor contained additional information not captured by the remaining factors, particularly in Europe and Japan.
Table 3
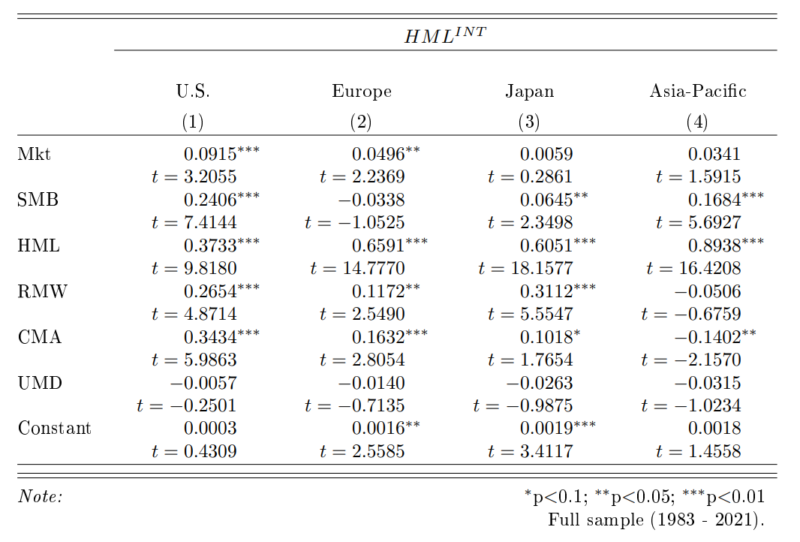
The results are hypothetical results and are NOT an indicator of future results and do NOT represent returns that any investor actually attained. Indexes are unmanaged and do not reflect management or trading fees, and one cannot invest directly in an index.
- Providing a risk-based explanation for the intangible value factor, stocks with high intangible-adjusted B/M ratios contained considerably higher levels of operating leverage, resulting in elevated levels of financial distress, and were more exposed to tighter funding constraints (firms cannot use intangibles as collateral and therefore face tighter borrowing constraints), especially in bad times. In addition, they were less flexible adjusting to different economic states. Thus, when liquidity dried up, stock markets underperformed or intermediary risk increased, the intangible value factor underperformed.
- Behavioral biases such as the extrapolation bias or sentiment did not indicate a significant relationship for explaining the return difference.
- Alleviating the concern that the outperformance of HMLINT over HML was due to historically lucky industry exposure, the findings did not suggest that HMLINT was superior to a within-industry version. In fact, the results suggested that a within-industry factor outperformed HMLINT. Thus, an industry-neutral version of HMLINT may have been an even superior factor.
- Neither knowledge nor organizational capital produced a much stronger version of HMLINT.
His findings led Vincenz to conclude: “HMLINT is not only highly correlated to HML, it also carries significant information not subsumed by other traditional equity factors. Therefore, this research shows how equity investors can significantly expand their efficiency portfolios.” He added that the research shows that “the intangible value factor sorts more effectively on productivity, profitability, financial soundness, and on other valuation ratios such as P/E or P/S. Moreover, given the improved sorting on fundamentals relative to traditional value, the intangible value factor may largely avoid value traps.” He also noted that while research has found that the value factor becomes redundant when adding the profitability (robust-minus-weak, or RMW) and investment (conservative-minus-aggressive, or CMA) factors to describe returns of the cross-section of stocks, there remains a “a pronounced contribution of intangible value.”
Vincenz also provided another risk-based explanation for the HMLINT factor. Investors view firms with more intangible assets as riskier because outside options of key talent govern the proportion of a company’s cash flows that shareholders receive and thus require a higher risk premium to invest in such companies.
Conflicting Findings
Savina Rizova and Namiko Saito of Dimensional Fund Advisors, authors of the 2021 study “Internally Developed Intangibles and Expected Stock Returns,” estimated the value of internally developed intangibles systematically across global markets over time by accumulating the historical spending on R&D (to capture the development of knowledge capital) and SG&A (to capture the development of organization capital) and amortizing them at fixed rates. While they, too, found that adding estimated internally developed intangibles would have had a slightly positive impact on the value premium over the long term and would have mitigated (but not eliminated) its underperformance in recent years, they also found that this impact was primarily driven by differences in sector weights—adjusting for sector differences largely eliminated premium differences. Their findings led them to conclude: “Our research does not find compelling evidence that we should include estimates of internally developed intangibles in company fundamentals such as book equity. The estimation of internally developed intangibles contains a lot of noise. Perhaps due to this high level of noise, we find that estimated internally developed intangibles provide little additional information about future firm cash flows beyond what is contained in current cash flows.” The result was that adjusting for internally generated intangibles did not improve upon the use of a combination of traditional value metrics plus sorting for profitability. I spoke with the AQR research team and learned that their conclusions are broadly consistent with those of Dimensional.
Interestingly, Rizova and Saito also found that “while the ratios of estimated internally developed intangibles to assets vary across sectors, they have been stable over time for each sector.” Their findings are why Dimensional’s value strategies do not attempt to adjust for internally generated intangibles. Instead, they use the traditional HML metric but also sort for profitability.
Investor Takeaway
While the value factor’s extended underperformance over the decade ending October 2020 could have multiple explanations, a promising one is the ineffective accounting expression of book values under existing accounting rules. Intangible assets, which have become increasingly important to the economy, are not reflected in book values, and therefore popular value metrics, such as the B/M ratio, may be “mismeasured.” In addition, intangibles provide an intuitive risk-based explanation for an HMLINT premium. It is worth noting that other value metrics, such as price-to-sales (which is not affected by accounting for intangibles), did not work during the “dark winter” for value stocks. This shows that the poor performance of the value factor was less about how the worth of a stock was measured and more about the price aspect (growth stocks outperformed because the multiple of earnings investors were willing to pay for them increased dramatically relative to the multiple for value stocks).
Academics and fund managers have been trying to address the valuation issues related to intangibles not being on the balance sheet through various methods. One is to use alternatives to price-to-book (P/B) as the value metric, such as price-to-earnings (P/E), price-to-cash flow (P/CF) and enterprise value-to-earnings before interest, taxes, depreciation and amortization (EV/EBITDA). Many fund families (such as Alpha Architect, AQR, BlackRock, Bridgeway and Research Affiliates) use multiple value metrics (such as P/E, P/CF, P/S and EBITDA/EV), some of which indirectly provide exposure to the profitability factor. Another alternative is to add other factors into the definition of the eligible universe. For example, since 2013 Dimensional has included a sort for profitability in their value funds. A third alternative is to add back to book value an estimate of the value of intangible R&D and organization expenses. Another way to address the issue is to apply what some call “contextual” stock selection, using different metrics or different weightings of those metrics depending on the intangible intensity. For example, if book value is not well specified for industries with high intangibles, it may be less effective in those industries than in industries with low intangibles.
At any rate, at least for most practitioners, the exclusive use of the traditional HML factor to build a value portfolio is no longer standard practice. Stay tuned, as we are likely to see more research on this important subject.
Larry Swedroe is head of financial and economic research for Buckingham Wealth Partners.
For informational and educational purposes only and should not be construed as specific investment, accounting, legal, or tax advice. Certain information is based upon third party data which may become outdated or otherwise superseded without notice. Third party information is deemed to be reliable, but its accuracy and completeness cannot be guaranteed. Indices are not available for direct investment. Their performance does not reflect the expenses associated with the management of an actual portfolio nor do indices represent results of actual trading. Information from sources deemed reliable, but its accuracy cannot be guaranteed. By clicking on any of the links above, you acknowledge that they are solely for your convenience, and do not necessarily imply any affiliations, sponsorships, endorsements or representations whatsoever by us regarding third-party websites. We are not responsible for the content, availability or privacy policies of these sites, and shall not be responsible or liable for any information, opinions, advice, products or services available on or through them. The opinions expressed by featured authors are their own and may not accurately reflect those of Buckingham Strategic Wealth® or Buckingham Strategic Partners®, collectively Buckingham Wealth Partners. Neither the Securities and Exchange Commission (SEC) nor any other federal or state agency have approved, determined the accuracy, or confirmed the adequacy of this article. LSR-22-449
About the Author: Larry Swedroe
—
Important Disclosures
For informational and educational purposes only and should not be construed as specific investment, accounting, legal, or tax advice. Certain information is deemed to be reliable, but its accuracy and completeness cannot be guaranteed. Third party information may become outdated or otherwise superseded without notice. Neither the Securities and Exchange Commission (SEC) nor any other federal or state agency has approved, determined the accuracy, or confirmed the adequacy of this article.
The views and opinions expressed herein are those of the author and do not necessarily reflect the views of Alpha Architect, its affiliates or its employees. Our full disclosures are available here. Definitions of common statistics used in our analysis are available here (towards the bottom).
Join thousands of other readers and subscribe to our blog.