While sustainable investing continues to gain in popularity, economic theory suggests that if a large enough proportion of investors choose to favor companies with high sustainability ratings and avoid those with low sustainability ratings (sin businesses), the favored company’s share prices will be elevated and the sin stock shares will be depressed. In equilibrium, the screening out of certain assets based on investors’ tastes should lead to a return premium on the screened assets.
The result is that the favored companies will have a lower cost of capital because they will trade at a higher P/E ratio. The flip side of a lower cost of capital is a lower expected return to the providers of that capital (shareholders). And the sin companies will have a higher cost of capital because they will trade at a lower P/E ratio, the flip side of which is a higher expected return to the providers of that capital.
The hypothesis is that the higher expected returns (a premium above the market’s required return) are required as compensation for the emotional cost of exposure to offensive companies. On the other hand, investors in companies with higher sustainability ratings are willing to accept the lower returns as the cost of expressing their values.
There is also a risk-based hypothesis for the sin premium. It is logical to hypothesize that companies neglecting to manage their ESG exposures are subject to greater risk (that is, a wider range of potential outcomes) than their more ESG-focused counterparts. The argument is that companies with high sustainability scores have better risk management and compliance standards. The more robust controls lead to fewer extreme events such as environmental disasters, fraud, corruption, and litigation (and their negative consequences). The result is a reduction in tail risk in high-scoring firms relative to the lowest-scoring firms. The greater tail risk creates the sin premium.
In our book, “Your Essential Guide to Sustainable Investing,” Sam Adams and I presented the evidence from about 60 studies that were entirely consistent with economic theory—sustainable investors should expect lower returns, but their investments also entail less risk.
New Research
Christina Bannier, Yannik Bofinger, and Björn Rock, authors of the study “The Risk-Return Tradeoff: Are Sustainable Investors Compensated Adequately?,” published in the May 2023 issue of the Journal of Asset Management, investigated the risk-adjusted returns from investing according to corporate social responsibility (CSR) criteria using factor model estimations for a large sample of U.S. firms over the period 2003-2017. Their sample included stocks from all publicly listed U.S. companies that received a CSR score in Refinitiv’s ASSET4 database. The CSR rating of Refinitiv comprises three dimensions: the environmental, social, and governance pillars. The three pillars are based on more than 400 measures collected annually from companies’ and other public disclosures. The environmental pillar covers issues such as resource use, emissions, and innovation; the social component focuses on the workforce, human rights, community, and product responsibility; and the governance component is concerned with management issues, shareholder relations, and CSR strategy. It should be noted that the pillar scores are percentile ranks. In contrast, the environmental and social categories are benchmarked against the TRBC Industry Group, and the governance categories are benchmarked against the respective Country Group. The combined CSR scores range from 0 to 100, where higher ratings reflect a higher sustainability assessment of the firm.
Bannier, Bofinger, and Rock’s goal was to determine whether the return per unit of risk increased or decreased with higher CSR activity. To identify the CSR intensity that would allow investors to optimize their portfolio returns for a given amount of risk, they related factor-adjusted portfolio returns to various risk measures (standard deviation, downside risk, and skewness). Here is a summary of their key findings:
- Value-weighted equity portfolios of firms with higher CSR yielded lower returns calculated with the Carhart four-factor (market beta, size, value, and momentum) model and the Fama and French five-factor (market beta, size, investment, profitability, and value) model.
- The top 20% (Quintile 5) yielded a significant abnormal return of 19 basis points per month, while investing into the quintile of firms with the lowest CSR (Quintile 1) scores delivered an even higher significantly positive alpha of 59.3 basis points per month. The difference portfolio that was long in the 20% most CSR-active firms and short in the 20% most CSR-inactive firms yielded a highly significant negative alpha of -40.3 basis points per month. The table below presents the Carhart four-factor model regressions of value-weighted monthly returns from firm portfolios sorted by their respective CSR score and subdivided into quintiles:
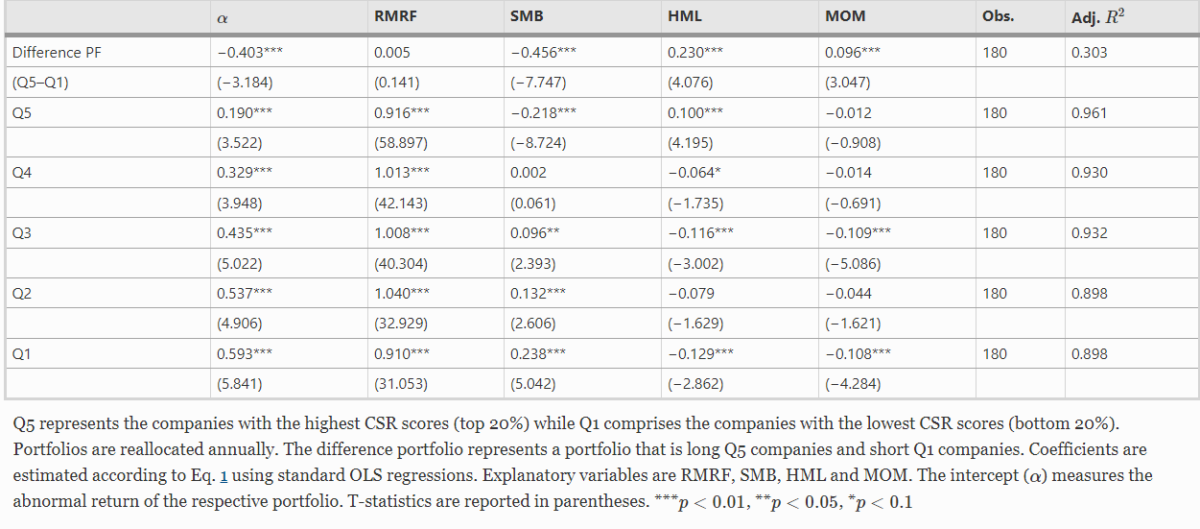
The results are hypothetical results and are NOT an indicator of future results and do NOT represent returns that any investor actually attained. Indexes are unmanaged and do not reflect management or trading fees, and one cannot invest directly in an index.
- In a test of robustness, five-factor portfolio analysis delivered qualitatively identical results of increasing alphas in conjunction with decreasing CSR portfolio levels, as did equally weighted portfolios.
- Combining the CSR-return effect with the risk-reducing effect of CSR by building return-to-risk ratios, they found that the ratios decreased with increasing CSR.
Investments into low ESG-rated portfolios yielded the highest return per unit of risk. This result was robust with respect to different equity risk measures as well as different return estimations. The following table presents ratios of average return to average risk from firm portfolios sorted by their respective CSR score:
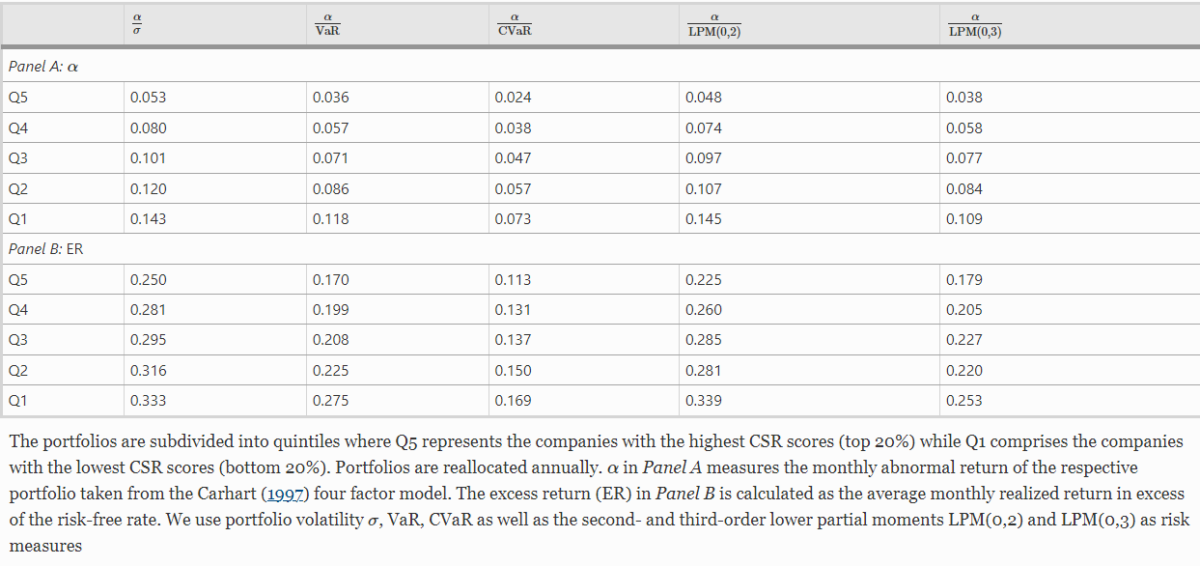
The results are hypothetical results and are NOT an indicator of future results and do NOT represent returns that any investor actually attained. Indexes are unmanaged and do not reflect management or trading fees, and one cannot invest directly in an index.
- Their results were not overly driven by the industry composition of their sample.
The finding that firms with lower CSR activity offered higher abnormal returns (after controlling for risk factors) than firms with stronger CSR activity demonstrates that investors associate lower corporate social responsibility with higher risk and thus require a higher expected return. However, their findings led the authors to conclude that “equity returns in our sample decrease even more strongly than the corresponding risks with rising CSR activities.” They added: “Though firms that do not engage strongly in corporate social responsibility are indeed perceived to be exposed to higher risks than CSR-active firms, the higher return seems to more than overcompensate the higher risk. Overall, therefore, the investment return per unit of risk is more favourable for CSR-inactive firms than for those with strong CSR activities.”
Investor Takeaways
Academic research has demonstrated that the higher risk associated with less sustainable firms should be compensated by higher returns. It also has shown that more sustainable firms have less investment risk. Bannier, Bofinger, and Rock contributed to the literature by demonstrating that higher returns to less sustainable firms are sufficient to “overcompensate” investors for the risk they bear—the lowest-scoring firms produced the highest risk-adjusted returns. Thus, from a purely economic perspective, the optimal return-to-risk ratio is achieved for a portfolio that invests in the lowest CSR-rated firms. With that said, some investors do not make portfolio decisions purely based on seeking to achieve the highest possible outperformance. Instead, they invest to contribute to a sustainable transformation of firms and economies. The takeaway for those investors is to recognize that they are accepting not only lower expected returns, but lower risk-adjusted expected returns, to invest in accordance with their sustainability preferences.
Larry Swedroe is head of financial and economic research for Buckingham Wealth Partners. The opinions expressed here are their own and may not accurately reflect those of Buckingham Wealth Partners, collectively Buckingham Strategic Wealth, LLC and Buckingham Strategic Partners, LLC. For informational and educational purposes only and should not be construed as specific investment, accounting, legal, or tax advice. Neither the Securities and Exchange Commission (SEC) nor any other federal or state agency have approved, determined the accuracy, or confirmed adequacy of this article. Information may be based on third party data which may become outdated or otherwise superseded without notice. Third party information is deemed to be reliable, but its accuracy and completeness cannot be guaranteed. By clicking on any of the links above, you acknowledge that they are solely for your convenience, and do not necessarily imply any affiliations, sponsorships, endorsements or representations whatsoever by us regarding third-party websites. We are not responsible for the content, availability or privacy policies of these sites, and shall not be responsible or liable for any information, opinions, advice, products or services available on or through them. LSR-23-520
About the Author: Larry Swedroe
—
Important Disclosures
For informational and educational purposes only and should not be construed as specific investment, accounting, legal, or tax advice. Certain information is deemed to be reliable, but its accuracy and completeness cannot be guaranteed. Third party information may become outdated or otherwise superseded without notice. Neither the Securities and Exchange Commission (SEC) nor any other federal or state agency has approved, determined the accuracy, or confirmed the adequacy of this article.
The views and opinions expressed herein are those of the author and do not necessarily reflect the views of Alpha Architect, its affiliates or its employees. Our full disclosures are available here. Definitions of common statistics used in our analysis are available here (towards the bottom).
Join thousands of other readers and subscribe to our blog.