As a general rule of thumb, the more complexity that exists in a Wall Street creation, the faster and farther investors should run.
—David Swensen, Unconventional Success
Structured products are packages of synthetic investment instruments specifically designed to appeal to needs that investors perceive are not being met by available securities. They are often packaged as asset allocation tools that can be used to reduce portfolio risk. Structured products usually consist of a note and a derivative—the product derives its economic value from the price of another asset, typically a bond, commodity, currency, or equity. That derivative is often an option (a put or a call). The note pays the interest at a set rate and schedule, and the derivative establishes payment at maturity.
Because of the derivative component, structured products are often promoted to investors as debt securities. Depending on the structured product, full protection of the principal invested is sometimes offered. In other cases, only limited protection may be offered, or even no protection.
Retail investors searching for yield and high returns seem to love these products—according to SRP about $94 billion was invested in 31,416 structured products in 2022, exceeded only by the $101 billion sold in 2021. Unfortunately, the empirical research demonstrates that these are products meant to be sold (the issuer benefits from a lower cost of capital), never bought (investors earn large negative risk-adjusted returns). Why, then, are they popular? For the same reasons many financial products are popular—they either carry large commissions for the sellers or so greatly favor the issuers that they push the products on unsophisticated investors who cannot fathom the complexity (but are assured by the salespeople and the advertising that these are good and often safe products).
Following is a short summary of the findings from empirical research.
The Evidence
Petra Vokata, author of the October 2020 study “Engineering Lemons” covering the period January 2006-September 2015 and more than 21,000 products, found that investors paid 7 percent on average in annual fees and subsequently lost 7 percent per year relative to risk-adjusted benchmark returns. She noted that the underlying securities were typically highly volatile stocks with high idiosyncratic volatility selected systematically to support high headline rates and moderate downside protection. Their average beta was over 1.5 – a value common for the top beta decile of U.S. stocks.
Vokata conservatively estimated that U.S. retail investors lost more than $1.5 billion over the period studied. She also found: “Conflicted payments—kickbacks and commissions to the brokers recommending the products—account for nearly half of all YEP [yield enhancement product] fees.” Most disturbing was that “brokers targeting YEP sales to elderly investors—for whom YEPs are less likely to be suitable—is consistent with broker efforts to exploit investors’ cognitive limitations.”
Brian Henderson and Neil Pearson, authors of the study “The Dark Side of Financial Innovation: A Case Study of the Pricing of a Retail Financial Product” published in the May 2011 issue of the Journal of Financial Economics, found that the offering prices of 64 issues of a popular retail structured equity product were almost 8 percent greater on average than estimates of the products’ fair market values obtained using option pricing methods, and the mean expected return estimate on the structured products was slightly below zero. The authors concluded that the issuing firms either shrouded some aspects of their innovative securities or introduced complexity to exploit uninformed investors.
Geng Deng, Ilan Guedj, Joshua Mallett, and Craig McCann, authors of the August 2011 study “The Anatomy of Principal Protected Absolute Return Barrier Notes,” examined the evidence on ARBNs (absolute return barrier notes). They are structured products that guarantee to return the face value of the note at maturity and pay interest if the underlying security’s price doesn’t vary excessively. The principal protection feature guarantees the full payback of the note’s face value at maturity as long as the investor holds the note to maturity and the issuer does not default. The study covered 214 ARBNs issued by six different investment banks. Most of the products were linked to indexes such as the S&P 500 and the Russell 2000. They found that the ARBNs’ fair price was approximately 4.5 percent below the actual issue price—investors were paying $1 for something that was worth just 95.5 cents. Given that ARBNs are generally short-term investments, with maturities typically ranging from six months to three years (most are between 12 and 18 months), 4.5 percent is a hefty premium to pay. The authors also found that the yields on ARBNs were lower than the corresponding corporate yields. Many were even lower than the risk-free rate!
Carole Bernard, Phelim Boyle, and William Gornall, authors of the study “Locally-Capped Investment Products and the Retail Investor” published in the Summer 2011 issue of the Journal of Derivatives, found that the contracts were overpriced relative to their fair values by about 6.5 percent on average. Geng Deng of Wells Fargo, Tim Dulaney, Tim Husson, Craig McCann, and Mike Yan, authors of the study “Ex Post Structured Product Returns: Index Methodology and Analysis” published in the Summer 2015 edition of the Journal of Investing, analyzed the ex-post returns of more than 20,000 individual structured products issued by 13 leading investment firms from 2007 through 2014. They constructed a structured product index and subindexes for reverse convertibles, single observation (SO) reverse convertibles, tracking securities, and autocallable securities by valuing each structured product in their database each day. The table below presents the mean returns, standard deviations, and Sharpe ratios for the five structured product indexes as well as the comparable figures for the S&P 500 Index and the Barclay Aggregate Bond Index.
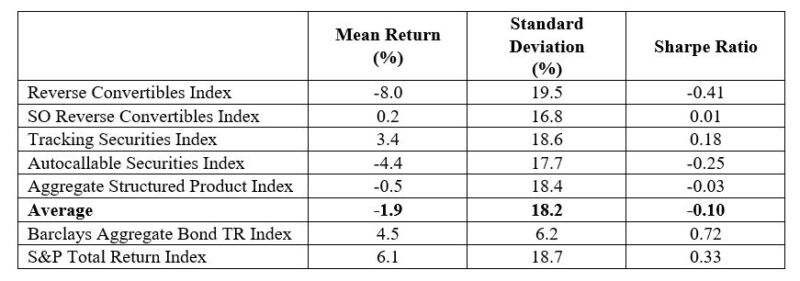
The results are hypothetical results and are NOT an indicator of future results and do NOT represent returns that any investor actually attained. Indexes are unmanaged and do not reflect management or trading fees, and one cannot invest directly in an index.
To isolate the performance results from the issue of overpricing on the date of issuance, the authors also calculated the initial “shortfall” in pricing:
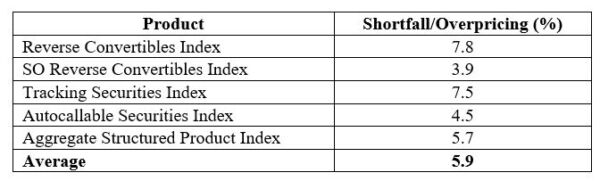
The results are hypothetical results and are NOT an indicator of future results and do NOT represent returns that any investor actually attained. Indexes are unmanaged and do not reflect management or trading fees, and one cannot invest directly in an index.
The results clearly show that structured products have dramatically underperformed alternative allocations to stocks and bonds because of overvaluing the products. The authors concluded: “Results of our index analysis should cause investors and their advisers to avoid structured products.”
New Evidence
Brian Henderson, Neil Pearson, and Li Wang contribute to the literature on structured notes and the behavior of retail investors with their study “Retail Derivatives and Sentiment: A Sentiment Measure Constructed from Issuances of Retail Structured Equity Products” published in the August 2023 issue of The Journal of Finance. They proposed a new measure of retail investor sentiment for individual stocks that is constructed from issuance volumes of retail structured equity products (SEPs) that provide synthetic long exposure to the SEPs’ reference stocks.
They constructed “the measure for each month and underlying reference stock as the ratio of SEPs issuance proceeds to the underlying stock’s market capitalization, normalized by the sum of the ratios. Due to the normalization, the sentiment measures sum to one and thus are interpretable as portfolio weights.” They then tested whether this measure predicted future stock returns. Their data sample covered the period 2004-2019. They began by noting that their SEPs sentiment measure differs from other sentiment measures because it is based on the purchases of the subset of retail investors who buy SEPs and thus are almost certainly unsophisticated. Here is a summary of their key findings:
- An aggregate market-wide measure of SEP issuance volumes was highly correlated with the Baker-Wurgler sentiment index – proxies for investor attention and sentiment predict SEP issuances.
- Stocks for which SEP issuance volumes were high during a month experienced large negative abnormal returns during the next month. Using the Fama-French three-factor (beta, size, and value), Carhart four-factor (beta, size, value, and momentum) and Fama-French five-factor (beta, size, value, profitability, and investment) models as benchmarks, the abnormal returns were -1.25% (t-statistic = -4.51), -1.23% (t-statistic = -4.45), and ‑1.09% (t-statistic = -3.83), respectively. By the third month, there was no predictive value—the market had corrected the overpricing.
Table I Regressions of SEP sentiment-weighted portfolio excess returns on market factors This table presents results of regressing monthly excess returns of portfolios formed using the sentiment measure Gt,n on the factor returns of the Fama-French (1993, 2015) three- and five-factor models and the Carhart (1997) four-factor model. Each month, we form a portfolio in which the weight for each stock is the principal amount of SEP issues based on the stock during month t, normalized by the stock’s market capitalization at the previous month end, and divided by the aggregate normalized SEP issue principal over the trailing month. We then estimate regressions in which the dependent variable is the SEP-sentiment-weighted portfolio excess return in month t + 1 and the covariates are the factor portfolio returns over the same month, and report the results in the table. Panels A through C report the results using Fama-French three-, Carhart four-, and Fama-French five-factor models, respectively. The left two columns of each panel present the coefficient estimates and corresponding t-statistics over the full sample period running from January 2004 through December 2019. The right two columns report the results using a sample beginning in January 2006.
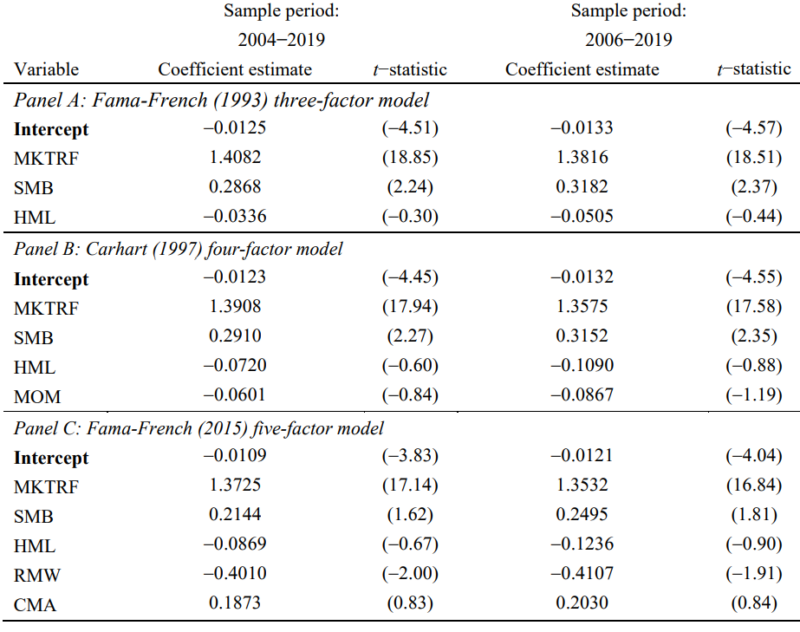
The results are hypothetical results and are NOT an indicator of future results and do NOT represent returns that any investor actually attained. Indexes are unmanaged and do not reflect management or trading fees, and one cannot invest directly in an index.
- In tests of robustness, negative abnormal returns were also found relative to other models that include behavioral factors and relative to other factors that have been shown to have predictive value (idiosyncratic volatility, short interest, the 52-week high, short-term reversals, and lottery characteristics).
- Weighted by proceeds, 81 percent of SEPs reference stocks had market capitalizations falling in the top decile of CRSP stocks, and 89 percent of SEPs were based on top quintile stocks—SEP issuance volumes predict negative abnormal returns on widely followed, liquid, large capitalization stocks that are generally easy to borrow and sell short.
- A significant part of the negative abnormal return was realized during short windows around earnings announcement dates, consistent with overvaluation being corrected as information is released.
Their findings led Henderson, Pearson, and Wang to conclude: “Our interpretation of this predictability is that SEPs issuance volumes proxy for retail investor sentiment, defined as beliefs about future stock prices that are not justified by rational evaluation of available information. We hypothesize that high issuance volumes are correlated with high retail investor sentiment and overvaluation, which is subsequently corrected.” They added: “The pricing of SEPs based on individual stocks is extremely disadvantageous to retail investors.”
In their 1990 paper “The Noise Trader Approach to Finance,” Andrei Shleifer and Lawrence Summers offered this astute observation: “When noise traders are optimistic about particular securities, it pays arbitrageurs to create more of them. These securities might be mutual funds, new share issues, penny oil stocks, or junk bonds: anything that is overpriced at the moment. It also pays to carve up corporate cash flows in ways that make the securities with claims to these flows most attractive to investors. … Just as entrepreneurs spend resources to build casinos to take advantage of gamblers, arbitrageurs build investment banks and brokerage firms to predict and feed noise trader demand.”
Investor Takeaways
Wall Street’s product machine is continuously pumping out fairy tales. Their product innovations can also be called “fanciful tales of legendary deeds.” The only difference is that they are intended for adults. Like the apple the Evil Queen offered Snow White, they have shiny features designed to entice naive investors. And despite the many fanciful tales available, they have one thing in common: Despite their seeming appeal, they have attributes that make them more attractive to the seller than the buyer. Thus, the main takeaway is that structured products should be avoided.
The other takeaway is that SEP issuances reveal the stocks demanded by unsophisticated retail investors. They are likely overvalued.
Larry Swedroe is head of financial and economic research for Buckingham Wealth Partners. Informational and educational purposes only and should not be construed as specific investment, accounting, legal, or tax advice. Certain information may be based on third party data and may become outdated or otherwise superseded without notice. Third party information is deemed to be reliable, but its accuracy and completeness cannot be guaranteed. By clicking on any of the links above, you acknowledge that they are solely for your convenience, and do not necessarily imply any affiliations, sponsorships, endorsements or representations whatsoever by us regarding third-party websites. We are not responsible for the content, availability or privacy policies of these sites, and shall not be responsible or liable for any information, opinions, advice, products or services available on or through them. Indices are not available for direct investment. Their performance does not reflect the expenses associated with the management of an actual portfolio nor do indices represent results of actual trading. Information from sources deemed reliable, but its accuracy cannot be guaranteed. Performance is historical and does not guarantee future results. All investments involve risk, including loss of principal. The opinions expressed here are their own and may not accurately reflect those of Buckingham Strategic Wealth or its affiliates. Neither the Securities and Exchange Commission (SEC) nor any other federal or state agency have approved, determined the accuracy, or confirmed the adequacy of this article. LSR-23-539
About the Author: Larry Swedroe
—
Important Disclosures
For informational and educational purposes only and should not be construed as specific investment, accounting, legal, or tax advice. Certain information is deemed to be reliable, but its accuracy and completeness cannot be guaranteed. Third party information may become outdated or otherwise superseded without notice. Neither the Securities and Exchange Commission (SEC) nor any other federal or state agency has approved, determined the accuracy, or confirmed the adequacy of this article.
The views and opinions expressed herein are those of the author and do not necessarily reflect the views of Alpha Architect, its affiliates or its employees. Our full disclosures are available here. Definitions of common statistics used in our analysis are available here (towards the bottom).
Join thousands of other readers and subscribe to our blog.