In his 2012 paper “The Other Side of Value: The Gross Profitability Premium,” Robert Novy-Marx demonstrated that profitability, as measured by gross profits-to-assets, had roughly the same power as book-to-market (value factor) in predicting the cross-section of average returns – profitable firms generated significantly higher returns than unprofitable firms despite having significantly higher valuation ratios. Controlling for profitability also dramatically increased the performance of value strategies, especially among the largest, most liquid stocks. Just as there are various measures of value, there are various measures of quality, with one being Marx’s gross profits-to-assets.
As the research team at Verdad explained in their article “Sources of Returns,” Novy-Marx demonstrated that:
“Value and quality are philosophically and economically related because they both aim to purchase future streams of income at a discount today. While quality strategies purchase highly profitable firms at average prices, value strategies purchase average profitability firms at low prices. These two approaches are philosophically similar as they seek to benefit from multiple expansion over time as valuation discounts close in tandem with improved fundamentals.”
While the approaches are similar, they are also complementary, as value stocks and quality stocks are not only very different firms in terms of characteristics (such as profitability and growth in earnings), but their returns have been virtually uncorrelated (correlation of only about 0.1 since 1963).
Verdad showed that:
“Whereas an annually rebalanced value strategy tends to have negative earnings growth over a one-year horizon, a quality strategy tends to have positive earnings growth over the same horizon. That is because value strategies rebalance into the cheapest stocks in the market, and these heavily discounted opportunities tend to be firms whose operations are stabilizing. On the other hand, quality strategies rebalance into highly profitable firms that are growing at an unremarkable pace of around 5% per year, broadly in line with long-term nominal GDP growth and close to the market median growth rate.”
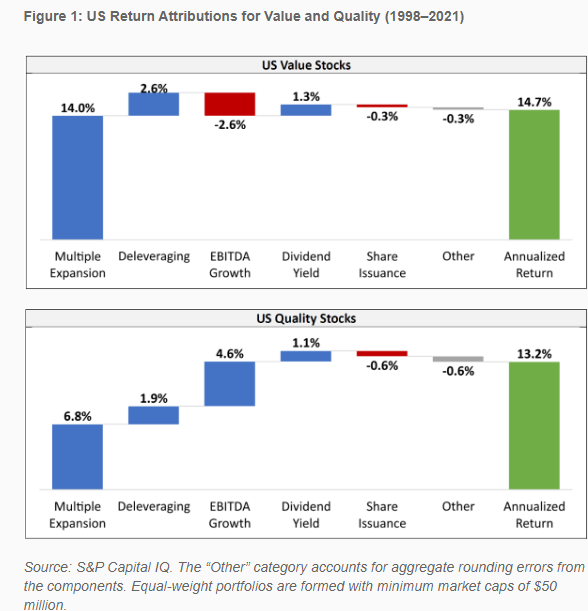
Over 1998-2021, Verdad showed that value stocks returned 14.7% per annum, outperforming the return of 13.2% per annum of quality stocks and 9.1% for the CRSP 1-10 Total Market Index. Examining return attribution for value and quality stocks over the period, they found stark differences (see chart below):
- Almost all the value’s performance came from multiple expansion (14.0%), while EBITDA growth subtracted 2.6%.
- About half (6.8%) of quality’s return was explained by multiple expansion, while EBITDA growth contributed 4.6%.
- Deleveraging added more to the return of value stocks (2.6% vs. 1.9%). The deleveraging effect was calculated as the change in net debt over the one-year horizon divided by the net debt at the start of the horizon. Reductions in debt were reflected as positive return contributions. Companies that started the horizon with net cash were marked as “NA” in the calculation. And companies that began with net debt and ended the year with net cash showed a debt reduction.
- Dividend yield contributed slightly more to the return of value stocks (1.3% vs. 1.1%).
Share issuance subtracted slightly more from the return to quality stocks (0.6% vs. 0.3%).
The results are hypothetical results and are NOT an indicator of future results and do NOT represent returns that any investor actually attained. Indexes are unmanaged and do not reflect management or trading fees, and one cannot invest directly in an index.
Verdad noted that the multiple expansion gap favoring value was due to value stocks having been bought at much cheaper multiples:
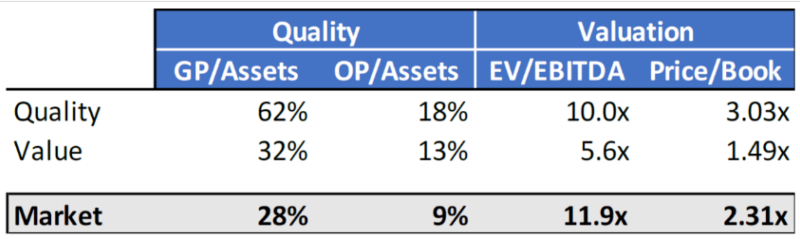
“Over the 23 years between 1998 and 2021, the cheapest 20% of US firms traded at a median valuation of 5.6x EV/EBITDA, whereas the most profitable 20% of US firms traded at a median valuation of 10x EV/EBITDA.”
The authors explained why value and quality work: “Relative to the market, quality works by purchasing double the amount of profitability in terms of Gross Profits/Assets and Operating Profit/Assets at roughly the same valuation multiples as the market. And value works by purchasing roughly the same level of profitability as the market at nearly half the valuation.”
The results are hypothetical results and are NOT an indicator of future results and do NOT represent returns that any investor actually attained. Indexes are unmanaged and do not reflect management or trading fees, and one cannot invest directly in an index.
Verdad’s findings are consistent with those of the authors of the 2018 study “Factors from Scratch: A look back, and forward, at how, when, and why factors work.” Chris Meredith, Jesse Livermore, and Patrick O’Shaughnessy of O’Shaughnessy Asset Management (OSAM) analyzed U.S. equity data from June 1964-October 2017 (I highly recommend reading this paper). Their findings led them to draw the following conclusions about value stocks:
- Companies generally fall into the “value” category because of underlying uncertainty in their earnings trajectory. This uncertainty is reflected in a lower stock price and a lower valuation.
- An annually rebalanced value strategy systematically buys into this uncertainty, anticipating that the companies’ underlying fundamentals are more stable than the pessimistic views embedded in the cheap price—the expectation being that prices will converge on their fair values.
- As value companies’ fundamentals stabilize in years two to four of a hold period, their valuation continues to re-rate through multiple expansion. This numerous expansion begins in advance of an improvement in fundamentals, with the steepest re-rating occurring in the first 12 months of a hold period. The initial return boost from multiple expansion generally offsets the earnings weakness in the first 12 months prior to stabilization, resulting in a value premium.
In their study “Drivers of Deep Value: International Evidence,” Brian Chingono and Nick Schmitz of Verdad examined whether OSAM’s findings held in developed international markets. Their findings in Europe and Japan were broadly similar to the U.S. research—multiple expansion tended to more than offset earnings weakness during the first 12 months of holding international value portfolios.
Investor Takeaways
Value, profitability, and quality are factors that meet all of the criteria for investment that Andrew Berkin and I established in our book “Your Complete Guide to Factor-Based Investing”: persistence, pervasiveness, robustness, implementability, and logical risk- or behavioral-based explanations for why investors should expect their premium return to persist and thus be considered when building portfolios.
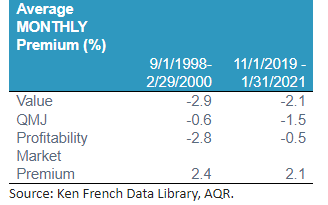
While their returns have been uncorrelated, there are periods when these factors have performed poorly when market beta has performed well. The following table shows the monthly average premiums for the value, profitability, and quality factors covering two periods where all three produced significant negative premiums while the market premium was large.
The results are hypothetical results and are NOT an indicator of future results and do NOT represent returns that any investor actually attained. Indexes are unmanaged and do not reflect management or trading fees, and one cannot invest directly in an index.
Definitions are as follows:
Profitability is from Ken French Data Library. From French’s site: The portfolios are formed on profitability (OP) at the end of each June using NYSE breakpoints. OP for June of year t is annual revenues minus cost of goods sold, interest expense, and selling, general, and administrative expenses divided by book equity for the last fiscal year end in t-1.
Quality (QMJ) is from AQR’s Data Library. From AQR: Quality score is the average of four aspects of quality: Profitability, Growth, Safety, and Payout. We use a broad set of measures to compute each of four aspects of quality. The score for each aspect is the average of the individual z-scores of the underlying measure. Each variable is converted each month into ranks and standardized to obtain the z-score. Profitability is measured by gross profit over assets, return on equity, return on assets, cash flow over assets, gross margin, and the fraction of earnings composed of cash. Growth is measured by the five-year growth in profitability, averaged across the measures of profitability above. For each profitability measure, five-year growth is defined as the change in the numerator divided by the lagged denominator. Safety is defined as companies with low beta, low idiosyncratic volatility, low leverage, low bankruptcy risk, and low ROE volatility. Payout is defined using equity and debt net issuance and total net payout over profits.
There were even periods, though rare, when all the premiums were negative. For example, over the period November 2019-March 2020, the monthly premiums were negative for all four factors: value (-4.8%), quality (-0.5%), profitability (-1.2%), and market beta (-3.0%). This demonstrates that the value, quality, and profitability factors are diversifiers of equity risk, not hedges.
Just as there were periods when the market beta premium was positive and the others were negative, demonstrating the benefits of factor diversification, the reverse also was true. For example, over the period April 2000-September 2002, while the monthly market beta premium was -2.1%, the monthly value, quality, and profitability premiums were 2.4%, 2.2%, and 2.7%, respectively.
A second takeaway is to note the important role deleveraging played in the returns to both value and quality stocks. The current environment of high and rising interest rates provides companies with leverage an incentive to pay down their debt more quickly to contain interest expenses. That could provide a tailwind for value and quality investors.
Larry Swedroe is head of financial and economic research for Buckingham Wealth Partners. For informational and educational purposes only and should not be construed as specific investment, accounting, legal, or tax advice. Certain information is based on third party data and may become outdated or otherwise superseded without notice. Third party information is deemed to be reliable, but its accuracy and completeness cannot be guaranteed. Indices are not available for direct investment. Their performance does not reflect the expenses associated with the management of an actual portfolio nor do indices represent results of actual trading. Information from sources deemed reliable, but its accuracy cannot be guaranteed. Performance is historical and does not guarantee future results. All investments involve risk, including loss of principal. By clicking on any of the links above, you acknowledge that they are solely for your convenience, and do not necessarily imply any affiliations, sponsorships, endorsements or representations whatsoever by us regarding third-party websites. We are not responsible for the content, availability or privacy policies of these sites, and shall not be responsible or liable for any information, opinions, advice, products or services available on or through them. Neither the Securities and Exchange Commission (SEC) nor any other federal or state agency have approved, determined the accuracy, or confirmed adequacy of this article. LSR-23-527.
About the Author: Larry Swedroe
—
Important Disclosures
For informational and educational purposes only and should not be construed as specific investment, accounting, legal, or tax advice. Certain information is deemed to be reliable, but its accuracy and completeness cannot be guaranteed. Third party information may become outdated or otherwise superseded without notice. Neither the Securities and Exchange Commission (SEC) nor any other federal or state agency has approved, determined the accuracy, or confirmed the adequacy of this article.
The views and opinions expressed herein are those of the author and do not necessarily reflect the views of Alpha Architect, its affiliates or its employees. Our full disclosures are available here. Definitions of common statistics used in our analysis are available here (towards the bottom).
Join thousands of other readers and subscribe to our blog.