With growing global concerns over climate change, environmental, social, and governance (ESG) investments continue to attract attention and fund flows. According to Morningstar’s “Global Sustainable Fund Flows: Q2 2023 in Review,” the global sustainable fund universe had assets under management of around $2.8 trillion, representing about 6.5% of total global fund assets.
The enthusiasm for ESG-related practice runs high in private markets. A Bain & Company 2022 report showed that around 70% of surveyed limited partners incorporated an ESG approach in their investment policies. This survey also reported that 50% of limited partners considered ESG an additive to investment performance. On the other hand, a 2023 Pitchbook (a Morningstar company) survey on sustainable investing (covering both impact investing and ESG risk) showed that a top concern for private market investors was the potential negative influence on returns.
Economic Theory
Sustainable investing continues to gain popularity, with investors worldwide frequently attracted not only by ethical concerns but also by the lure of superior returns. However, economic theory suggests that if a large enough proportion of investors choose to favor companies with high sustainability ratings (green businesses) and avoid those with low sustainability ratings (brown, or sin, businesses), the favored companies’ share prices will be elevated, and the excluded shares will be depressed. Thus, in equilibrium, the screening out of certain assets based on investors’ preferences/tastes should lead to a return premium on those assets.
As Sam Adams and I explained in our 2022 book, Your Essential Guide to Sustainable Investing, the evidence has generally been consistent with economic theory. While excluded (low-ESG-scoring) stocks have produced higher returns, the picture is not all one-sided, as the excluded stocks are likely to be subject to greater risk; companies with high sustainability scores have better risk management, better compliance standards and are less likely to be subject to consumer boycotts. Their more robust controls lead to fewer extreme events such as environmental disasters, fraud, corruption, and litigation (and their negative consequences). The result is a reduction in tail risk in high-scoring firms relative to the lowest-scoring firms. The greater tail risk creates the “sin” premium.
New Research
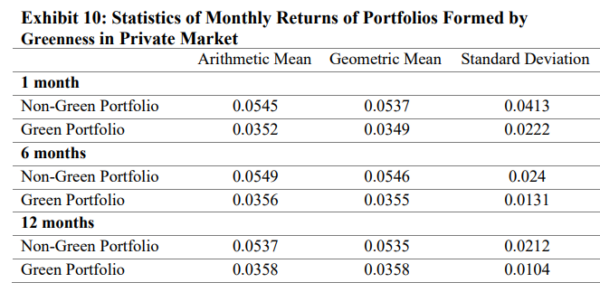
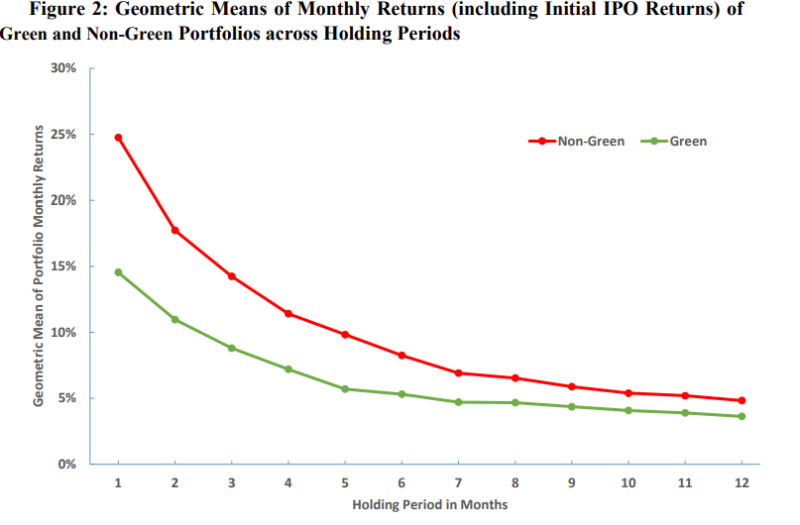
Morningstar’s Albert Zhao and Thomas Idzorek contribute to the ESG literature with their June 2023 study, “ESG Role in Equity Performance in Private Market, Primary Market and Secondary Market,” in which they investigated the role of ESG characteristics in those markets. They studied the whole lifespan of a firm—as a private equity firm in the private market, the initial public offering (IPO), and post-IPO performance in the secondary public market. Their dataset merged the private market firm dataset from Pitchbook with the public market stock dataset from Morningstar Direct, along with a dataset from Sustainalytics. To isolate the influence of ESG characteristics on IPO prices and to exclude other potential noise as much as possible, they analyzed the price data up to two months after the IPO, comparing the first and second month-end stock prices after IPO to their IPO prices. The dataset consisted of private equity firms with an IPO date from January 2012 to December 2021. Following is a summary of their key findings:
- ESG characteristics (and ESG risk scores) were very stable for publicly listed companies.
- Non-green equity outperformed green equity in both private and secondary markets.

- Green (non-green) equity was relatively overvalued (undervalued) at IPO—valuation/cash flow multiples at IPO were higher for green equity than non-green equity.
- More greenness led to lower short-term returns.
Statistics of First Month Returns of Public Portfolios Formed by Greenness

- The overvaluation (undervaluation) was magnified at the firm’s initial valuation in the private market.
- The overvaluation (undervaluation) continued in the primary market post IPO—non-green stocks realized higher price returns over the first two months following IPO, while green stocks realized lower price returns as the market prices adjusted to reflect what was considered to be the fair value on the ESG dimension.
- Unsurprisingly, firms categorized in the energy sector were the most undervalued at IPO across industrial sectors, causing their largest price returns in the short term. The real estate sector was the most overvalued.

Their findings led the authors to conclude: “In secondary market, green equity underperforms non-green equity in a short term after IPO. This is due to the relative overvaluation (undervaluation) of green (non-green) equity at IPO. Various models are tested, and the results are consistent. In the long term, by portfolio construction method, we find that green equity outperforms non-green equity. In private market, green equity also underperforms non-green equity since initial valuation till IPO. This is due to further overvaluation (undervaluation) of green (non-green) PE firm when it is first evaluated in private market.”
Words of Caution
As Sam Adams and I explained in Your Essential Guide to Sustainable Investing, the huge increase in cash flows from sustainable investors created conflicting forces, as investor preferences led to different short- and long-term impacts on asset prices and returns. Firms with high sustainable investing scores earned rising portfolio weights, leading to short-term capital gains for their stocks—realized returns rose temporarily. However, the long-term effect was that higher valuations reduced expected long-term returns. The result could be an increase in green asset returns even though brown assets earned higher expected returns. In other words, there can be an ambiguous relationship between carbon risk and returns in the short term. For example, the authors of the 2022 study “Dynamic ESG Equilibrium” found that despite investor preferences for sustainable investments creating a brown premium of about 1% per year over the period 2018-2020 the increased demand for sustainable investments led to a green portfolio outperforming by about seven percentage points a year (14% versus 7%). However, the long-term effect was that the higher valuations reduced expected long-term returns.
Investor Takeaway
Sustainable investment strategies should be expected to produce portfolios with less risk and thus, logically, should also be expected to produce lower returns in the long run (in equilibrium). With that said, in the short run, the continued popularity of sustainable strategies could create sufficient cash flows to offset the risk premium in the lower-scoring stocks, at least until an equilibrium is reached.
Larry Swedroe is head of financial and economic research for Buckingham Wealth Partners.
For informational and educational purposes only and should not be construed as specific investment, accounting, legal, or tax advice. Certain information may be based on third party data and may become outdated or otherwise superseded without notice. Third party information is deemed to be reliable, but its accuracy and completeness cannot be guaranteed. By clicking on any of the links above, you acknowledge that they are solely for your convenience, and do not necessarily imply any affiliations, sponsorships, endorsements or representations whatsoever by us regarding third-party websites. We are not responsible for the content, availability or privacy policies of these sites, and shall not be responsible or liable for any information, opinions, advice, products or services available on or through them. The opinions expressed here are their own and may not accurately reflect those of Buckingham Wealth Partners, collectively Buckingham Wealth Partners. Neither the Securities and Exchange Commission (SEC) nor any other federal or state agency have approved, determined the accuracy, or confirmed the adequacy of this article. LSR-23-546
About the Author: Larry Swedroe
—
Important Disclosures
For informational and educational purposes only and should not be construed as specific investment, accounting, legal, or tax advice. Certain information is deemed to be reliable, but its accuracy and completeness cannot be guaranteed. Third party information may become outdated or otherwise superseded without notice. Neither the Securities and Exchange Commission (SEC) nor any other federal or state agency has approved, determined the accuracy, or confirmed the adequacy of this article.
The views and opinions expressed herein are those of the author and do not necessarily reflect the views of Alpha Architect, its affiliates or its employees. Our full disclosures are available here. Definitions of common statistics used in our analysis are available here (towards the bottom).
Join thousands of other readers and subscribe to our blog.

