Expectations of future earnings growth matter a great deal to valuations because investors, in their collective wisdom, assign higher valuations to companies they expect will grow more quickly in the future (growth stocks). In contrast, firms expected to show slower growth (value stocks) are assigned lower valuations.
An implicit assumption in most forecasts is that growth is persistent. While analysts underwrite high growth for companies that have grown quickly and slow growth for companies that have grown slowly in the past, a large body of evidence demonstrates that reversion to the mean of both positive and negative abnormal earnings growth is the norm.
The Evidence
In their 1997 study, “Forecasting Profitability and Earnings,” Professors Eugene Fama and Kenneth French tested whether or not the theory of profitability reverting to the mean stood up to the historical data. They examined the profits of an average of 2,304 firms per year for the period 1964–95. Here were their conclusions:
- There was a strong tendency for profits to revert to the mean.
- Reversion to the mean was strongest when profits were highest (greatest incentive for competition to enter) and lowest (greatest incentive to leave an industry and reallocate assets, thereby reducing competition and restoring profits).
- Abnormally low earnings tended to revert even faster than abnormally high profits.
- Reversion to the mean occurred at a rate of about 40% per annum.
- Real-world forecasts tended to underestimate the speed at which reversion to the mean in profitability occurred.
Beyond Fama & French
Other studies, written long ago, came to the same conclusions in both U.S. and international stocks. Examples are the 1962 study, “Higgledy Piggledy Growth” the 1993 study, “Returns to E/P Strategies, Higgledy-Piggledy Growth, Analysts’ Forecast Errors, and Omitted Risk Factors,” and the 2002 study, “The Level and Persistence of Growth Rates.” In other words, it has long been known that reversion to the mean of abnormal earnings growth exists. That, combined with the high valuations of growth stocks and the low valuations of value stocks, provides at least one explanation for the historical value premium. (Another explanation is that the value premium reflects the greater risk of value stocks.)
The following are some examples from my 2006 book, “The Successful Investor Today.”
- From 1960 through 2000, corporate profits grew at a rate of 8%, right in line with nominal GNP growth. A company growing at a rate of 15% has to do about twice as well as the average company. However, it is supremely difficult to grow at 15% per annum over long periods. Only three of the Nifty Fifty growth stocks of 1972 were able to grow at that rate or better over the next 25 years. And none grew faster than 18% per annum. For the period from 1960 to 1980, just three companies were able to grow at 15% or greater (Standard Oil of Ohio, Philip Morris, and Boeing). For the period from 1970 to 1990, just four did so (Boeing, Philip Morris, Merck, and PPG Industries). And from 1980 to 1999, only five companies accomplished that goal (Fannie Mae, United Airlines, Philip Morris, Merck, and Abbott Laboratories).
- According to the researchers at Sanford C. Bernstein & Co., over an approximately 50-year period, ending in 2000 only 10% of companies in the S&P 500 have increased their earnings at an average rate of at least 20% a year for five years running. Only 3% have raised earnings at least 20% annually for a decade. And none have sustained 20% earnings growth for 15 years or more. In the long run, it’s just not possible for stock prices to rise faster than the earnings of the companies they represent.
A study on the ability of companies to maintain high levels of earnings growth, “The Level of Persistence of Growth Rates,” found that while some firms grew at high rates historically, they were relatively rare instances and about what we would randomly expect. Specifically, only four firms a year achieved annual growth rates above the median for a full 10-year run. That was just 0.2% of all firms and just 0.1% more than randomly expected. Only 3.6% achieved that goal for just five years. Randomly, we would expect 3.1% to do so. That was true even in fast-growing industries like technology and pharmaceuticals. They also found no persistence in long-term profit growth rates beyond chance. Further, the data indicated valuation ratios have little predictive ability in terms of future growth rates.
More Recent Evidence
In October 2022 Brian Chingono and Greg Obenshain of Verdad provided us with an update to the evidence on the persistence of growth rates. They began by citing evidence of the persistence of growth assumption:
“The Vanguard US Growth Index consists of companies that have grown their earnings by 28% on average over the past five years. These growth stocks are priced at 29x their trailing net earnings, a 52% premium to the overall US market’s 19x Price/Earnings ratio. The average company in the US market portfolio has increased earnings by 20% annually over the past five years, an impressive number that seems to warrant similar discount rates between the overall market and growth stocks.”
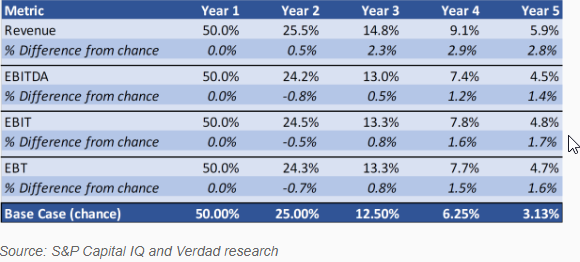
To determine if the same pattern of overestimating the persistence of growth existed out-of-sample, they examined all U.S. stocks between 1997 and 2022. As shown in the table below, for all four measures of growth, they found little to no evidence of persistence in earnings growth, beyond chance, over the long term.
Persistence of Growth Rates (1997–2021)
The results are hypothetical results and are NOT an indicator of future results and do NOT represent returns that any investor actually attained. Indexes are unmanaged and do not reflect management or trading fees, and one cannot invest directly in an index
The above evidence suggests that the hypothesis that secular changes in the economy over the past two decades have changed the conclusion that earnings growth is not persistent beyond chance over the long term is false. In other words, it’s not different this time.
Chingono and Obenshain next asked:
“What if we focus specifically on firms that have demonstrated the highest level of earnings growth in the past? Would the highest fliers of the past have a better chance of maintaining above-median growth in the future?”
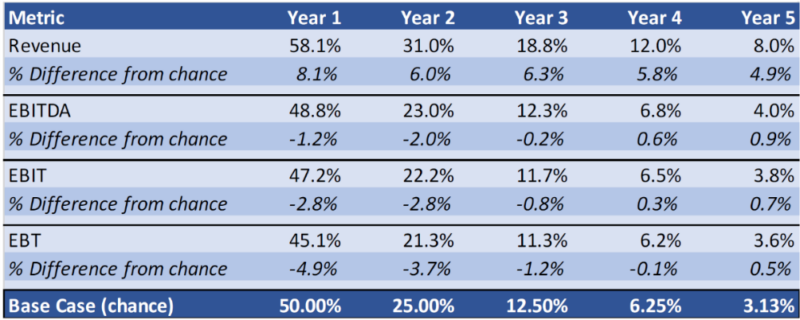
To answer that question, they adjusted their analysis by isolating firms that were in the top quartile of growth over the previous year. The table below presents the results:
Persistence Among Firms Starting in the Top Quartile (1997–2021)
The results are hypothetical results and are NOT an indicator of future results and do NOT represent returns that any investor actually attained. Indexes are unmanaged and do not reflect management or trading fees, and one cannot invest directly in an index
Zeroing on the Top Tiers
When focusing specifically on past top-quartile performers, there was relatively more persistence in revenue growth. But moving further down the income statement toward earnings measures, any persistence beyond chance approached zero.
Because investors care most about cumulative growth rather than persistence of growth, Chingono and Obenshain also looked at cumulative growth over the next one to five years to determine if past winners continued to outgrow the market median on a cumulative basis.
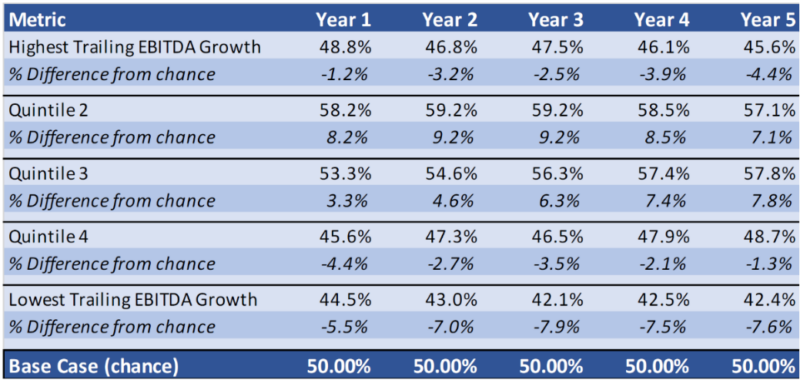
Cumulative EBITDA Persistence by Previous 1-Yr EBITDA Growth (1997–2021)
The results are hypothetical results and are NOT an indicator of future results and do NOT represent returns that any investor actually attained. Indexes are unmanaged and do not reflect management or trading fees, and one cannot invest directly in an index
The outcomes for the highest trailing growth quintile are indistinguishable from the outcomes in the lowest trailing growth quintile. Past winners essentially had the same long-term outcomes as past losers in terms of cumulative EBITDA (earnings before interest, taxes, depreciation and amortization) growth.
Latest research
In December 2023 Chris Satterthwaite of Verdad revisited the question of the persistence of growth by examining the persistence of valuation multiples. He found that roughly 50% of the most expensive stocks (those in the top quartile, the most “growthy” stocks) remained in the top quartile one year later. Roughly 30% dropped into the next quartile, while roughly 10% fell to the second-cheapest quartile and the cheapest quartile, respectively.
Persistence of “Expensive” Valuations in the U.S.
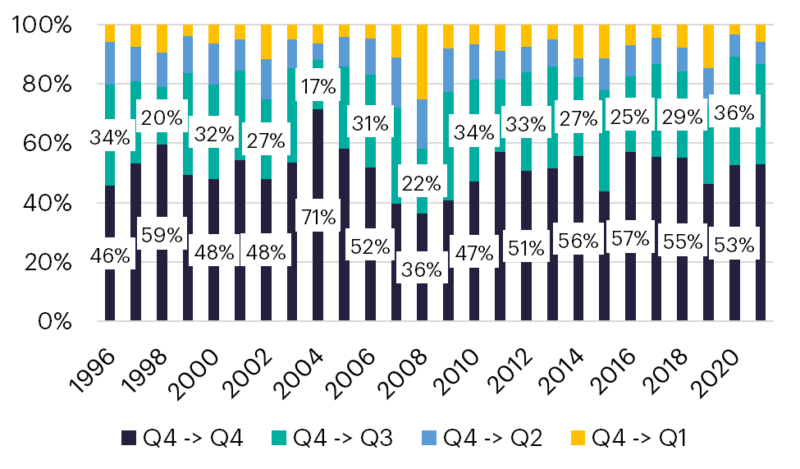
The picture looked slightly different for the lowest quartile of value (the cheapest stocks). On average, 75% of the cheapest quartile of companies in the U.S. remained in the cheapest quartile one year later, while 17% graduated to the second quartile, and 5% and 3% moved to the third and fourth quartile, respectively. Within the cheapest quartile, valuation multiples tended to mean revert, albeit gradually. Notably, the persistence of value had increased recently and was near the high end of the range since 1996, as shown below:
Persistence of “Cheapest” Valuations in the U.S.
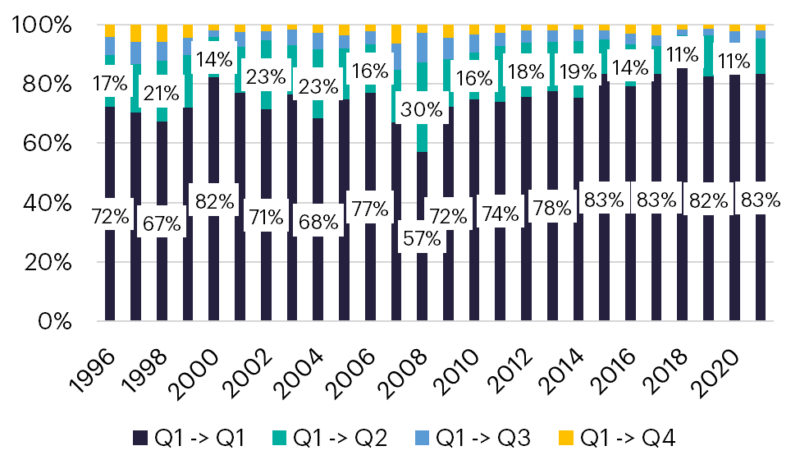
A Gradual Mean Reversion for the Cheapest Stocks
Satterthwaite explained:
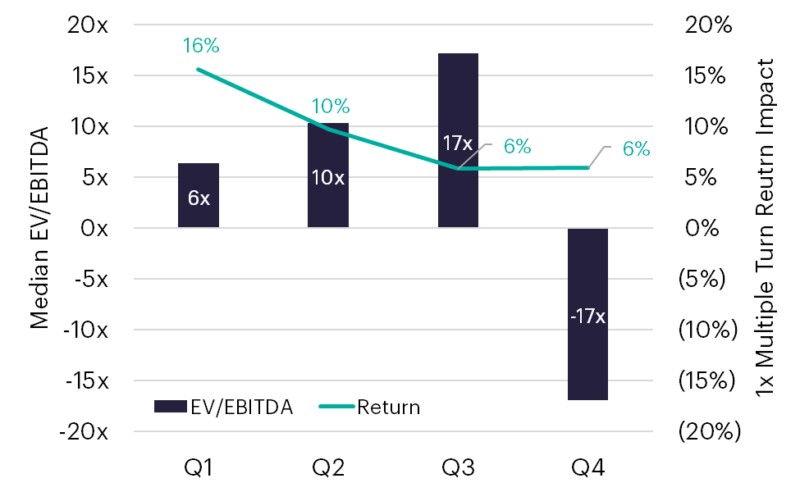
“The gradual mean reversion of multiples in the cheapest quartile is not surprising, in our opinion, for two reasons. First, investors are compensated to wait for the mean reversion. The average dividend yield, as of November 2023, of the cheapest US quartile (where our value metrics explicitly did not include dividend yield) was 3%, versus 0.5% for the most expensive quartile. Second, the cheapest quartile also has the most torque to an upward change in multiples. Companies in the cheapest US quartile have a median EV/EBITDA of 6x, versus -17x for the most expensive quartile. A 1x multiple increase has the biggest beneficial impact on equity returns for the cheapest quartile of companies, with a decreasing impact as the multiple increases, as shown in Figure 3 below. Note that the most expensive quartile has negative EBITDA.”
Figure 3: Median EV/EBITDA by Value Quartile and +1x Multiple Turn Impact
The results are hypothetical results and are NOT an indicator of future results and do NOT represent returns that any investor actually attained. Indexes are unmanaged and do not reflect management or trading fees, and one cannot invest directly in an index
Satterthwaite found very similar trends in both Europe and Japan:
“Expensive valuation multiples tend to revert quickly, consistent with the lack of persistence in growth, while cheap multiples revert to the mean more slowly.”
His findings led him to conclude:
“Growth is neither persistent nor predictable, as evidenced by the relatively high turnover among stocks in the most expensive quartile. Concurrently, the cheapest companies tend to see their multiples revert towards the mean gradually over time. Investors in the cheapest quartiles are compensated with significantly higher dividend yields and the most leverage to rising multiples as sentiment improves.”
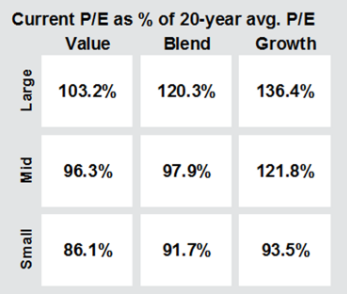
Current Valuations
With the evidence in mind, we can examine the valuations as of November 29, 2023, of value and growth stocks relative to their 20-year average. While large value stocks are trading slightly above their 20-year average, mid-cap value stocks are trading slightly below their average, and small value stocks are trading at about a 14% discount to their average value. On the other hand, large growth stocks are trading about 36% above their 20-year average P/E ratio, mid-cap growth stocks are trading at about 22% above their 20-year average, and small growth stocks are trading at about 6% below their 20-year average P/E ratio.
Investor Takeaways
The historical evidence demonstrates that an investment strategy that bets on growth is a strategy likely to disappoint because growth is neither persistent nor predictable and because value stocks should have an embedded risk premium (noting that risks, of course, can and do show up).
Likely, the evidence presented won’t settle the debate about whether the value premium is risk- or behavioral-based (if the latter is the case, the value premium is a free lunch). But the answer to the question doesn’t have to be black or white. Perhaps the value premium, while not being a free lunch (there’s plenty of evidence supporting a risk-based explanation), is at least a free stop at the dessert tray for those investors willing to accept their incremental economic cycle risk.
The bottom line is that value stocks historically have outperformed growth stocks, and if you think the explanation is risk-based, then you should expect this outperformance to continue. Your belief should be strengthened by the underperformance of value stocks over the past decade, which has left the spread in valuations between growth and value stocks at historically high levels (predicting a higher than historical value premium).
If you think the explanation is behavioral-based, then unless you expect investor behavior to change, you should expect value stocks to outperform as well. Finally, the outperformance of value stocks has been in the academic literature for many decades, and legendary investor Benjamin Graham advocated for the purchase of value stocks 80 years ago.
Disclosures
Larry Swedroe is the author or co-author of 18 books on investing, including his latest Enrich Your Future. For informational and educational purposes only and should not be construed as specific investment, accounting, legal, or tax advice. Certain information is based on third party data and may become outdated or otherwise superseded without notice. Past performance is not indicative of future results. Information from sources deemed reliable, but its accuracy cannot be guaranteed. Performance is historical and does not guarantee future results. All investments involve risk, including loss of principal. The opinions expressed here are their own and may not accurately reflect those of Buckingham Strategic Wealth, LLC or Buckingham Strategic Partners, LLC, collectively Buckingham Wealth Partners. Neither the Securities and Exchange Commission (SEC) nor any other federal or state agency have approved, determined the accuracy, or confirmed the adequacy of this article. LSR-24-609.
About the Author: Larry Swedroe
—
Important Disclosures
For informational and educational purposes only and should not be construed as specific investment, accounting, legal, or tax advice. Certain information is deemed to be reliable, but its accuracy and completeness cannot be guaranteed. Third party information may become outdated or otherwise superseded without notice. Neither the Securities and Exchange Commission (SEC) nor any other federal or state agency has approved, determined the accuracy, or confirmed the adequacy of this article.
The views and opinions expressed herein are those of the author and do not necessarily reflect the views of Alpha Architect, its affiliates or its employees. Our full disclosures are available here. Definitions of common statistics used in our analysis are available here (towards the bottom).
Join thousands of other readers and subscribe to our blog.