Among the many factors cited in academic research, only a handful have been sufficiently reliable for use in asset pricing models. One of those is momentum. The evidence has been robust for not only cross-sectional (relative) and time-series (absolute or trend) momentum, but also for factor momentum, which has received much attention from researchers. The empirical research on factor momentum, including the 2019 studies “Factor Momentum Everywhere” and “Is there Momentum in Factor Premia? Evidence from International Equity Markets,” the 2020 study “Factor Momentum and the Momentum Factor,” and the 2021 studies “Factor Momentum,” “Is Factor Momentum More than Stock Momentum?” and “Momentum-Managed Equity Factors,” has examined whether momentum can be found in factors as well and found:
- Time-series (trend) factor momentum has been a pervasive property of factors—a strategy that buys the recent top-performing factors and sells poor-performing factors achieved significant investment performance above and beyond traditional stock momentum.
- Factor momentum explained all forms of individual stock momentum—stock momentum strategies indirectly timed factors; they profited when the factors remained autocorrelated and crashed when those autocorrelations broke down.
- Demonstrating pervasiveness, factor momentum has been a global phenomenon.
- Factor momentum could have been captured by trading almost any set of factors.
- Industry momentum stemmed from factor momentum.
- The value-added induced by factor management via short-term momentum was a robust empirical phenomenon that survived transaction costs and carried over to multifactor portfolios—while managing factors based on last month’s momentum increased turnover, the increase in turnover induced by timing did not outweigh the benefits of timing. In addition, turnover could have been reduced using a smoothed version of the timing signal, and timing still would have yielded significant benefits.
Latest Research
Christian Fieberg, Daniel Metko, and Adam Zaremba contribute to the literature with their study “Cross-Country Factor Momentum,” published in the February 2024 issue of Economic Letters, in which they examined whether factor returns exhibit a predictable cross-sectional variation across markets in line with their historical performance:
“For instance, should the value factor in Germany recently outpace Brazil’s, will this trend continue? Can we anticipate the German value strategy’s continued dominance over its Brazilian counterpart?” They called this phenomenon “cross-country factor momentum.”
To determine whether factors in high-performing countries maintained their lead over their underperforming counterparts, they examined 145 prominent factors from 51 countries spanning the period December 1986 to December 2021, analyzing both cross-sectional and time-series strategies based on past factor returns. They represented all factor strategies by long-short value-weighted portfolios that buy (sell) a tercile of stocks with the highest (lowest) expected return implied by the anomaly signal.
Every month, they sorted all countries in the sample according to the average return of factor i over the past 12 months (t-12 to t-1). They then divided the countries into two groups to compute cross-sectional and time-series strategies. The cross-sectional cross-country factor momentum strategy (XC-FMOMCS) for factor i involved taking a long position in factor i in countries where it yielded above-median returns in the previous year and a short position in those with below-median performance. Conversely, the cross-country time-series factor momentum strategy (XC-FMOMTS) assumed a long position in countries with positive factor i returns over the past 12 months and a short position in those with negative performance. Following is a summary of their key findings:
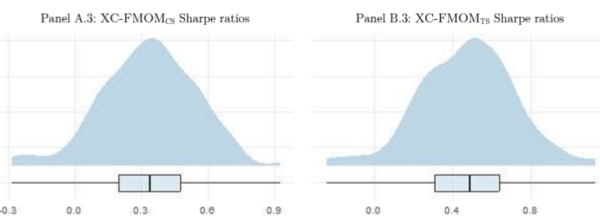
- Factors in countries with high returns consistently outperformed those with weaker performance. For cross-sectional momentum, in 136 out of 145 cases (94%), the tercile of countries with high past factor returns continued to outperform the tercile of countries with low past factor returns. Moreover, for 64 factors (44% of all cases), the difference was significant at the 5% level. The average return on a typical factor momentum strategy was 0.10% per month with an annualized Sharpe ratio of 0.33.
- The results were even more robust for time-series momentum strategies, with positive returns for 140 out of 145 anomalies considered; 96 of these cases achieved significance at the 5% level. On average, monthly returns to time-series momentum strategies were 0.16% with an annualized Sharpe ratio of 0.47 (most were between 0.3 and 0.6).
- Certain factors like size and value displayed particularly powerful performance persistence. With a Sharpe ratio exceeding 0.9, they beat a highly diversified benchmark that equally weights all anomalies in the sample.
- Countries were almost equally represented in the long and short legs, and there was no significant bias toward either position—cross-country factor momentum strategies were unlikely to generate profits simply by harvesting a risk premium associated with certain markets.
- The cross-country factor momentum effect remained robust to alternative factor momentum definitions, as well as to different portfolio weighting schemes and both long-short and long-only anomaly designs.
- Long-only strategies provided comparably strong results.
Figure 1. Performance Distributions for the Cross-Country Factor Momentum Strategies. The figure presents the density plots for the mean monthly returns (Panels A.1, B.1), their corresponding Newey-West (1987) adjusted t-statistics (A.2, B.2), and annualized Sharpe ratios (A.3, B.2) for the cross-sectional (XC-FMOMCS) and time-series (XC-FMOMTS) cross-country momentum strategies. The boxplots below the density plots indicate the quartiles and median, and the whiskers denote the maximum and minimum values.

The results are hypothetical results and are NOT an indicator of future results and do NOT represent returns that any investor actually attained. Indexes are unmanaged and do not reflect management or trading fees, and one cannot invest directly in an index.
Their findings led Fieberg, Metko, and Zaremba to conclude:
“Factors in winning countries consistently outperform those in losing countries. The effect holds across most anomalies and is robust to many considerations.”
Investor Takeaways
There is strong empirical evidence demonstrating that momentum (both cross-sectional and time-series) provides information on the cross-section of returns of many risk assets and has generated alpha relative to existing asset pricing models. Fieberg, Metko, and Zaremba’s study adds to that body of research by providing another test of both robustness and pervasiveness, increasing our confidence that the findings of momentum in asset prices are not a result of data mining.
The strong empirical evidence is why firms like Alpha Architect, AQR, Avantis, Bridgeway, and Dimensional, leaders in factor-investing strategies, incorporate momentum into their strategies. For example, based on research demonstrating the persistence of factor momentum, AQR recently added cross-sectional stock market factor momentum to their general managed futures strategy. Individual investors can utilize momentum strategies without incurring additional costs by incorporating momentum into trading decisions. For example, when rebalancing, they can delay purchases of assets with negative momentum and delay sales of assets with positive momentum.
Larry Swedroe is the author, or co-author, of 18 books on investing. His latest is “Enrich Your Future: The Keys to Successful Investing.”
About the Author: Larry Swedroe
—
Important Disclosures
For informational and educational purposes only and should not be construed as specific investment, accounting, legal, or tax advice. Certain information is deemed to be reliable, but its accuracy and completeness cannot be guaranteed. Third party information may become outdated or otherwise superseded without notice. Neither the Securities and Exchange Commission (SEC) nor any other federal or state agency has approved, determined the accuracy, or confirmed the adequacy of this article.
The views and opinions expressed herein are those of the author and do not necessarily reflect the views of Alpha Architect, its affiliates or its employees. Our full disclosures are available here. Definitions of common statistics used in our analysis are available here (towards the bottom).
Join thousands of other readers and subscribe to our blog.