Arbitrageurs keep markets efficient by moving prices to reflect their fundamental values. However, anomalies can persist because of limits to arbitrage—the costs and risks of shorting. The costs and risks of shorting, however, are not the only risks that arbitrageurs face. The publication of research on anomalies in asset pricing models has led to a dramatic increase in factor-based investment strategies related to exploiting anomalies, creating the risk that trades could become overcrowded.
Overcrowding occurs when the number of investors chasing a similar strategy becomes too large given the available liquidity. Overcrowding increases the risk of crashes, creating additional risks for arbitrageurs to consider. With this in mind, Renato Lazo-Paz, Fabio Moneta, and Ludwig Chincarini, authors of the October 2023 study “Crowded Spaces and Anomalies,” investigated the relationship between crowded trades (those in which many investors hold the same stocks, possibly exhausting their liquidity provision) and future stock returns on a set of well-known stock market anomalies.
For their empirical analysis, the authors used the Thomson/Refinitiv 13F Institutional Investors Holdings database as their measure of institutional positions in equities over the period 1980-2021. They used this data in conjunction with other data to estimate a broad set of crowding measures. As their main measure of crowding, they used days-ADV—the sum of investors’ holdings in dollars in a given stock divided by the average daily trading volume in dollars of that same stock. It represents how many days it would take institutions to exit all their positions. They excluded microcap stocks with a share price of less than $5 as well as utilities and financial firms. The exclusion of microcaps alleviated concerns about anomaly returns being driven by penny stocks and reduced the effect of potential market microstructure noise. They divided their sample into different types of institutional investors (such as mutual funds), investment advisors (mostly hedge funds), pension funds, and others. Following is a summary of their key findings:
- The proportion of shares outstanding owned by institutional investors steadily increased, reaching its peak of almost 79% around 2019.
- Between 1980 and 2020, the number of institutional investors grew by more than 10 times, from around 400 to more than 4,000. At the same time, the number of publicly listed companies peaked at 5,756 in the late 1990s and continuously decreased after that—institutional investors now face a larger number of investors that have access to a smaller pool of available securities, increasing the risk of crowding.
- Days-ADV experienced a decline in the first half of the sample-driven by the dramatic increase in trading volume at the end of the 1990s. However, there has been a positive increasing trend since the end of the 2000s.
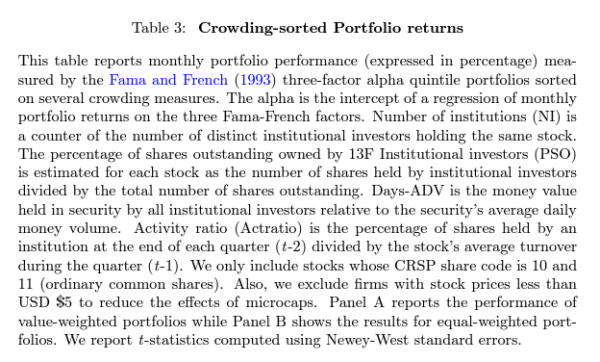
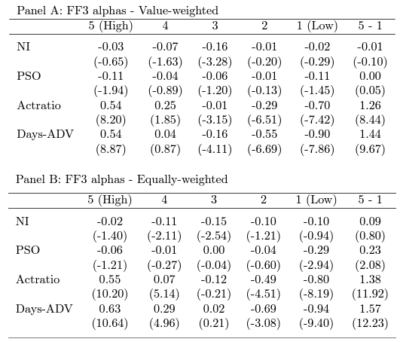
- On average, crowded stocks were associated with future superior returns, while the least crowded stocks provided inferior returns: Using days-ADV as the crowding variable, a value (equal)-weighted quintile portfolio of the most crowded stocks delivered a Fama-French three-factor monthly alpha of 0.54% (0.63%), while the alpha of the lowest crowding quintile was -0.90% (-0.94%). The difference was economically and highly statistically significant and was robust to different factor model specifications, including the Fama-French five-factor model, liquidity factors, and momentum. The spread portfolio (high-minus-low) had a monthly alpha of 1.44% (17.28% annualized) with a t‑stat of 9.67.
- The relationship between days-ADV and expected returns was robust in different states of the economy.
- The relationship between crowding and future returns was stronger for stocks mostly held by investment advisors and transient and short-horizon institutions.
- The most crowded stocks with high days-ADV relative to the least crowded stocks tended to be larger, had less turnover and smaller bid-ask spreads, but had a higher number of analysts following the stocks.
- There was a strong relationship between anomaly returns and crowding – a portfolio that was long the most crowded stocks in the long leg of anomalies and short the least crowded stocks in the short leg of the anomalies exhibited a significant risk-adjusted monthly return (three-factor alpha) of 1.7% across 11 anomalies. While there was a decay in the alpha of the anomalies post-publication, the alpha remained statistically significant for crowded stocks.


The results are hypothetical results and are NOT an indicator of future results and do NOT represent returns that any investor actually attained. Indexes are unmanaged and do not reflect management or trading fees, and one cannot invest directly in an index.
- The portfolio of anomaly stocks that were not part of the crowding portfolio showed no significant alphas—the abnormal returns of the anomalies were driven by the crowded stocks.
- Crowding was related to future crash risk, and the effect was stronger for anomaly stocks—crowding constitutes another limit to arbitrage, which reduces the correction of mispricing, and/or it leads to institutions requiring compensation for investing in crowded stocks because they are more exposed to crash risk.
Their findings led Lazo-Paz, Moneta, and Chincarini to conclude that their empirical findings “support the view that crowding influences anomaly returns, is positively related to crash risk, and plays a role in the limits of arbitrage by adding risk considerations.” They added that even post-publication, “Crowded equity positions in anomalies remain and have significant impacts in terms of risk and return dynamics.”
Larry Swedroe is the author or co-author of 18 books on investing, including his latest Enrich Your Future.
For informational and educational purposes only and should not be construed as specific investment, accounting, legal, or tax advice. Certain information is based on third party data and may become outdated or otherwise superseded without notice. Third party information is deemed to be reliable, but its accuracy and completeness cannot be guaranteed. Neither the Securities and Exchange Commission (SEC) nor any other federal or state agency have approved, determined the accuracy, or confirmed the adequacy of this article. LSR-23-592
About the Author: Larry Swedroe
—
Important Disclosures
For informational and educational purposes only and should not be construed as specific investment, accounting, legal, or tax advice. Certain information is deemed to be reliable, but its accuracy and completeness cannot be guaranteed. Third party information may become outdated or otherwise superseded without notice. Neither the Securities and Exchange Commission (SEC) nor any other federal or state agency has approved, determined the accuracy, or confirmed the adequacy of this article.
The views and opinions expressed herein are those of the author and do not necessarily reflect the views of Alpha Architect, its affiliates or its employees. Our full disclosures are available here. Definitions of common statistics used in our analysis are available here (towards the bottom).
Join thousands of other readers and subscribe to our blog.

