Stock Strategies and the January Barometer and the Yield Curve
- Lichend Sun, Chris Stivers, and Ajay Kongera
- A version of the paper can be found here.
- Want a summary of academic papers with alpha? Check out our free Academic Alpha Database!
Abstract:
The January Barometer states that the sign of the stock-market’s returns in January can predict the subsequent 11-month stock-market return over February–December. Cooper et al. (2010) show that the best way to use the January Barometer is to be long following positive Januarys and invest in T-bills following negative Januarys. In this study, similar to the January Barometer, we find that the 11-month average return following upwardsloping yield curves is significantly higher than the 11-month average return following downward-sloping yield curves. Further, we find that trading strategies that combine the trading signals from the January Barometer and the yield curve comfortably outperform the best strategy that relies on the January Barometer alone. We show that the combined ‘January barometer-yield curve’ strategy has lower risks and higher Sharpe ratios.
Data Sources:
CRSP, 1954-2010
Alpha Highlight:
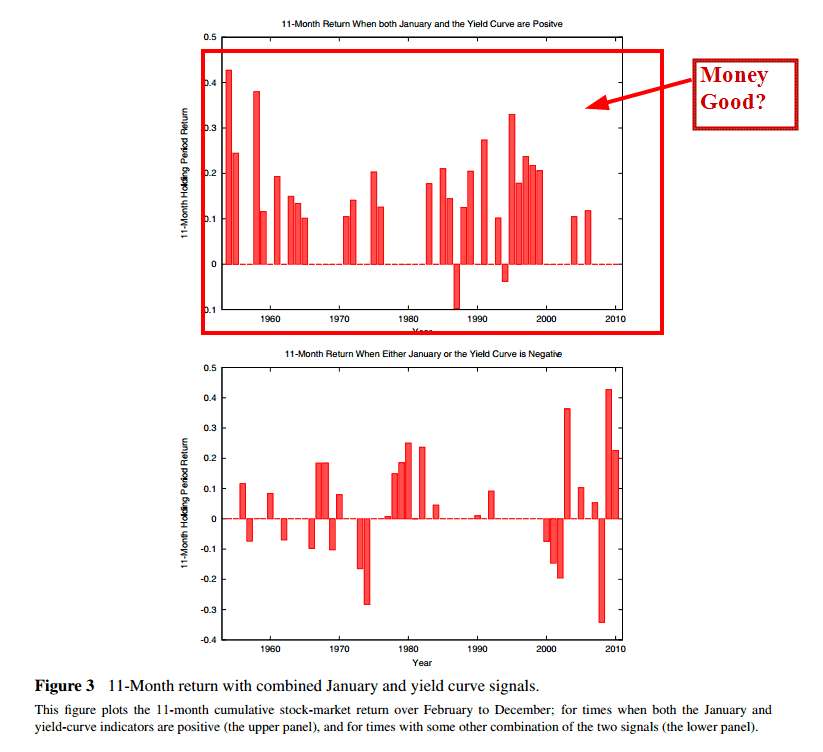
Combining the January effect and a positive yield curve generates some seriously good looking annual returns.
The results are hypothetical results and are NOT an indicator of future results and do NOT represent returns that any investor actually attained. Indexes are unmanaged, do not reflect management or trading fees, and one cannot invest directly in an index. Additional information regarding the construction of these results is available upon request.
Strategy Summary:
- There are two main variables of interest for this strategy:
- The return of the value-weighted index from CRSP each January.
- The December yield curve measured as the 10-year U.S. Treasury constant maturity rate minus the 1-year U.S. Treasury constant maturity rate.
- The paper combines the signals from the January stock returns and the December yield curve.
- Here is the strategy that performs the best:
- If the January stock returns are positive and the December yield curve is upward sloping (positive), go long the stock market from February to December. If either the January stock returns are negative or the December yield curve is downward sloping (negative), invest in T-bills from February to December.
- This stragey outperforms a long-only strategy, as well as using each signal individually.
- The average return for this strategy (while being invested in stocks each Januray) from 1954-2010 is 12.63%, with the worst annual performance being -7.70% in 2009.
Commentary:
- See Tables 5 – 7 to view the 5 different strategies that are compared in the paper.
- Shorting the market when the January return is negative or the yield curve is downward sloping yields the worst results (see Table 6).
- I smell data-mining. We would need to see similar results in other countries and get a laundry list of robustness tests before I believe this one.
Anyone tried these ideas before?

About the Author: Wesley Gray, PhD
—
Important Disclosures
For informational and educational purposes only and should not be construed as specific investment, accounting, legal, or tax advice. Certain information is deemed to be reliable, but its accuracy and completeness cannot be guaranteed. Third party information may become outdated or otherwise superseded without notice. Neither the Securities and Exchange Commission (SEC) nor any other federal or state agency has approved, determined the accuracy, or confirmed the adequacy of this article.
The views and opinions expressed herein are those of the author and do not necessarily reflect the views of Alpha Architect, its affiliates or its employees. Our full disclosures are available here. Definitions of common statistics used in our analysis are available here (towards the bottom).
Join thousands of other readers and subscribe to our blog.