The Orphan Equity Market: Recent Evidence
- Omid Sabbaghi and J. Matthew Lupton
- A version of the paper can be found here.
- Want a summary of academic papers with alpha? Check out our free Academic Alpha Database!
Abstract:
This study examines the informational efficiency of the orphan equity market during the 2000 to 2010 period. We identify firms emerging from Chapter 11 via the LoPucki Bankruptcy Research Database and find that the market is not surprised by their equity return performance. Using different tests, we provide support for the presence of informational efficiency in this market. In addition, we find that while orphan equities are associated with positive returns in the 150 days following emergence, they are poor investments in the long-run. Conducting cross-sectional regressions, we find that the expected return, as proxied by an asset pricing model, best explains the cross-sectional variation in realized returns in the long run. In the short run, a higher post-emergence price on the first day of trading is associated with lower realized returns.
Data Sources:
LoPucki Bankruptcy Research Database; S&P Research Insight Database.
Alpha Highlight:
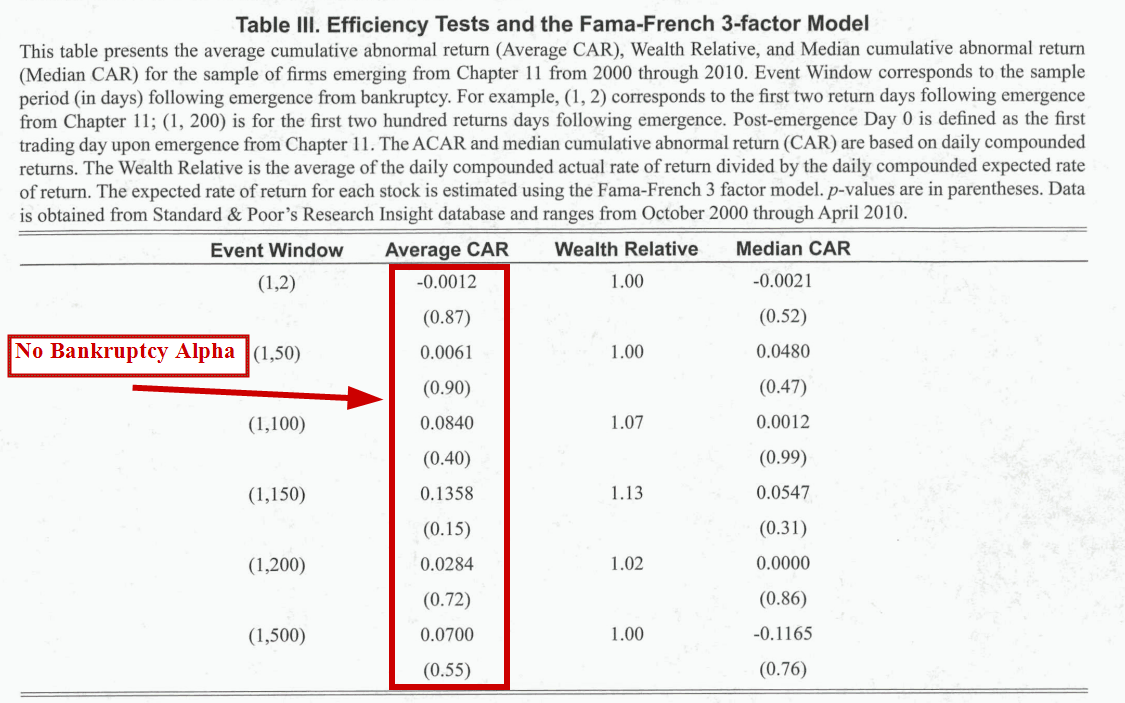
Table 3 highlights 3 factor abnormal returns. Abnormal returns are positive through 150 days, but insignificant from 0 (suggesting a lot of volatility in the results).
The results are hypothetical results and are NOT an indicator of future results and do NOT represent returns that any investor actually attained. Indexes are unmanaged, do not reflect management or trading fees, and one cannot invest directly in an index. Additional information regarding the construction of these results is available upon request.
Strategy Summary:
- Paper examines 43 orphan equities (firms emerging from Chapter 11 bankruptcy) from October 2000 until April 2010.
- Table 1 highlights that these orphan equities have good returns over short horizons.
- From day 1 to 150 (trading days after bankruptcy), the mean return is 12% and the median return is 3%.
- Table 1 also highlights that these are poor long-term investments.
- From day 1 to 500 (trading days after bankruptcy), the mean return is 9%, while the median return is -15%.
- The returns for this time period have significant variation, with a maximum return of 387%, a minimum return of -97%, and the standard deviation of returns being 0.97.
- Tables 2 and 3 show that these returns can be explained with asset pricing models (CAPM and FF 3-factor).
- Insignificant average and median CARs (return – expected return from asset pricing model) over all time periods.
- Tables 4 and 5 again show that asset pricing models can explain these returns.
- Significant loadings on expected returns from asset pricing models for longer-term returns (150, 200 and 500 day windows).
- Tables 4 and 5 also finds that higher day 0 prices (1st trading day after bankruptcy) leads to lower returns in the short-term (2, 50, and 100 day windows).
Commentary:
- More details would be nice to explain the calculation of the expected returns using asset pricing models.
- Only 43 observations, so it is difficult to say whether or not results would hold in a larger sample.
Looks like bankruptcy investing is simply a high risk way to access equity risk. Win some; lose some…but no alpha in the cards…

About the Author: Wesley Gray, PhD
—
Important Disclosures
For informational and educational purposes only and should not be construed as specific investment, accounting, legal, or tax advice. Certain information is deemed to be reliable, but its accuracy and completeness cannot be guaranteed. Third party information may become outdated or otherwise superseded without notice. Neither the Securities and Exchange Commission (SEC) nor any other federal or state agency has approved, determined the accuracy, or confirmed the adequacy of this article.
The views and opinions expressed herein are those of the author and do not necessarily reflect the views of Alpha Architect, its affiliates or its employees. Our full disclosures are available here. Definitions of common statistics used in our analysis are available here (towards the bottom).
Join thousands of other readers and subscribe to our blog.