The Misrepresentation of Earnings
- Dichev, Graham, Harvey, and Rajgopal
- A version of the paper can be found here.
- Want a summary of academic papers with alpha? Check out our Academic Research Recap Category!
Abstract:
We ask nearly 400 CFOs about the definition and drivers of earnings quality, with a special emphasis on the prevalence and detection of earnings misrepresentation. CFOs believe that the hallmarks of earnings quality are sustainability, absence of one-time items, and backing by actual cash flows. Earnings quality is determined in about equal measure by controllable factors like internal controls and corporate governance, and non-controllable factors like industry membership and macroeconomic conditions. On earnings misrepresentation, CFOs believe that in any given period a remarkable 20% of firms intentionally distort earnings, even though they are adhering to generally accepted accounting principles. The economic magnitude of the misrepresentation is large, averaging about 10% of reported earnings. While most misrepresentation involves earnings overstatement, interestingly, one third of the firms that are misrepresenting performance are low-balling their earnings or reversing a prior intentional overstatement. Finally, CFOs provide a list of red flags that can be used to detect earnings misrepresentation.
Alpha Highlight:
This paper doesn’t try to guess about how companies manipulate earnings, instead, they take a more direct approach and ask the companies–a novel idea!
The first question the authors ask is “What are the motivations for earnings misrepresentation?”
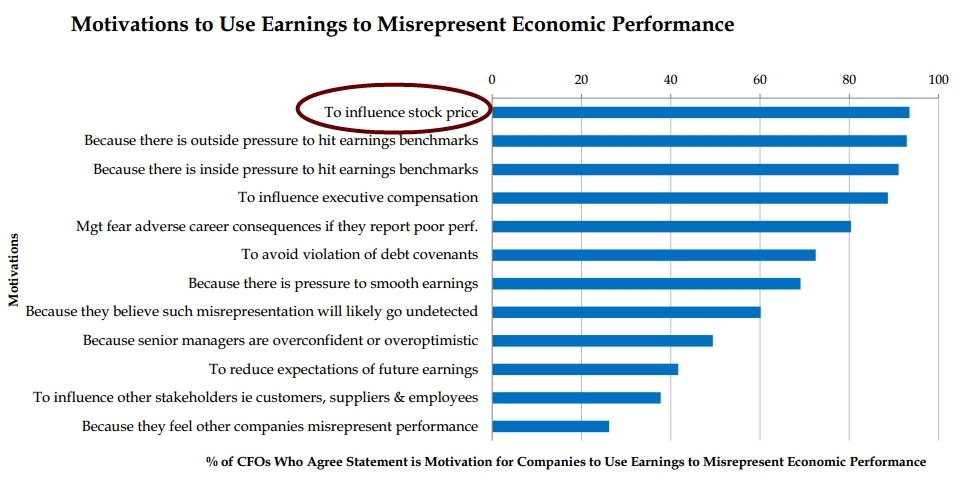
Not surprisingly, a company will influence earnings to try and move the stock around–duh! That said, it looks like they manipulate to reduce expectations about the future and to play Jedi mind tricks with the competition–very interesting!
What are the biggest red flags for earnings manipulation?
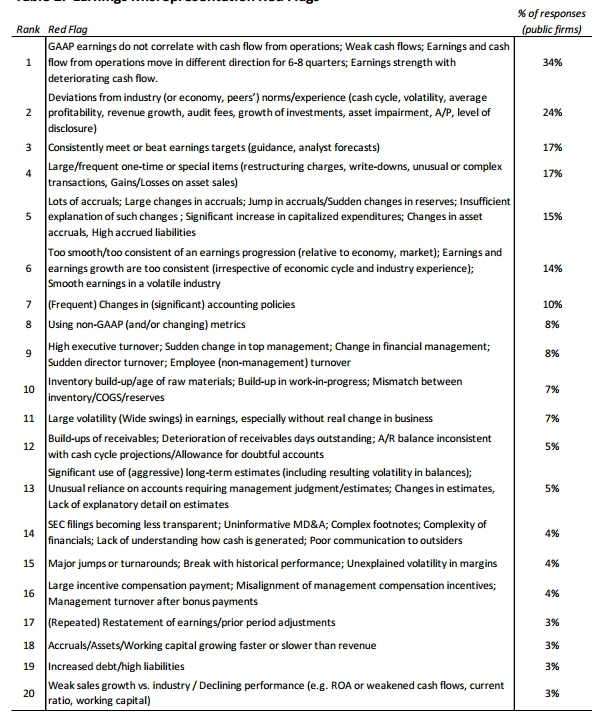
Well, we already knew about net income and cash flow mismatches (Quantitative Value has several chapters dedicated to forensic accounting). All the others are common sense at some level. The trick for forensic accounting is to build a systematic checklist and/or automated screening process that ensures one identifies and analyzes situations that may be susceptible to manipulation.
This is an awesome paper!
Here is a slide deck that outlines the paper’s main points: http://papers.ssrn.com/sol3/papers.cfm?abstract_id=2347428

About the Author: Wesley Gray, PhD
—
Important Disclosures
For informational and educational purposes only and should not be construed as specific investment, accounting, legal, or tax advice. Certain information is deemed to be reliable, but its accuracy and completeness cannot be guaranteed. Third party information may become outdated or otherwise superseded without notice. Neither the Securities and Exchange Commission (SEC) nor any other federal or state agency has approved, determined the accuracy, or confirmed the adequacy of this article.
The views and opinions expressed herein are those of the author and do not necessarily reflect the views of Alpha Architect, its affiliates or its employees. Our full disclosures are available here. Definitions of common statistics used in our analysis are available here (towards the bottom).
Join thousands of other readers and subscribe to our blog.