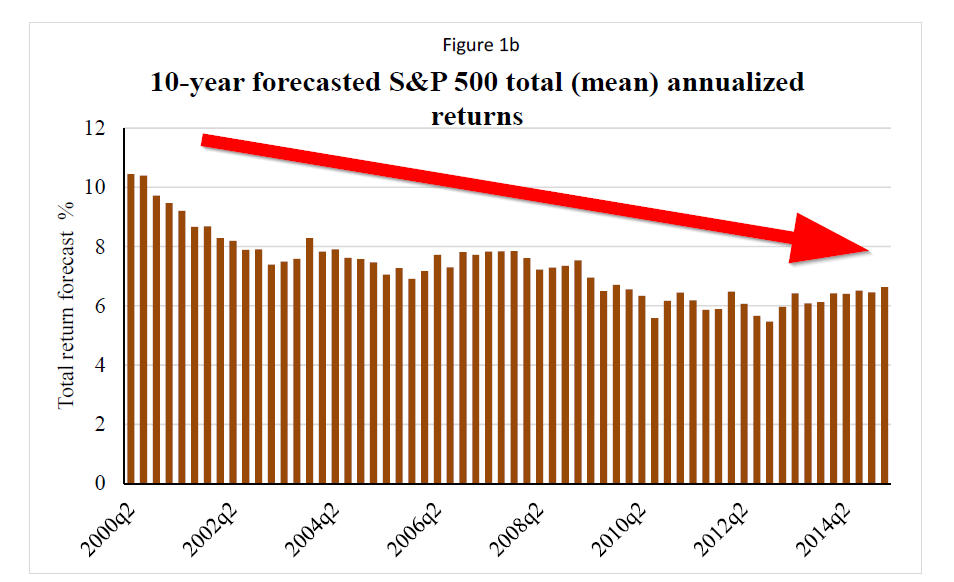
The Graham-Harvey survey is complete and the expectations of CFOs are available for review.
As the figure below highlights, expected returns on the S&P 500 have been gradually decreasing over time.
As of Q1 2015, the 10-year bond yield was projected at 2.12%.
The projected 10-year annualized return was 6.63% (2.12% 10-year + 4.51 equity premium).

The results are hypothetical results and are NOT an indicator of future results and do NOT represent returns that any investor actually attained. Indexes are unmanaged, do not reflect management or trading fees, and one cannot invest directly in an index. Additional information regarding the construction of these results is available upon request.
How in the world are the endowments and pensions going to hit their 8%+ bogies?
Learn more about equity return forecasting here.
Paper abstract below:
The Equity Risk Premium in 2015
We analyze the history of the equity risk premium from surveys of U.S. Chief Financial Officers (CFOs) conducted every quarter from June 2000 to March 2015. The risk premium is the expected 10-year S&P 500 return relative to a 10-year U.S. Treasury bond yield. We show that the equity risk premium has increased more than 50 basis points from the levels observed in 2014. The current 10-year risk premium is 4.51%. Similarly, measures of risk such as investor disagreement and perceptions of volatility have increased. Interestingly, the increased premium and risk are not reflected in market-based measures of risk, such as the VIX and credit spreads. We also link our survey results to measures survey-based measures of the weighted average cost of capital and investment hurdle rates. The hurdle rates are significantly higher than the cost of capital implied by the market risk premium.
About the Author: Wesley Gray, PhD
—
Important Disclosures
For informational and educational purposes only and should not be construed as specific investment, accounting, legal, or tax advice. Certain information is deemed to be reliable, but its accuracy and completeness cannot be guaranteed. Third party information may become outdated or otherwise superseded without notice. Neither the Securities and Exchange Commission (SEC) nor any other federal or state agency has approved, determined the accuracy, or confirmed the adequacy of this article.
The views and opinions expressed herein are those of the author and do not necessarily reflect the views of Alpha Architect, its affiliates or its employees. Our full disclosures are available here. Definitions of common statistics used in our analysis are available here (towards the bottom).
Join thousands of other readers and subscribe to our blog.

