Here is one of the figures in a Journal of Finance paper published in 2013 by N. Garleanu and L Pedersen.
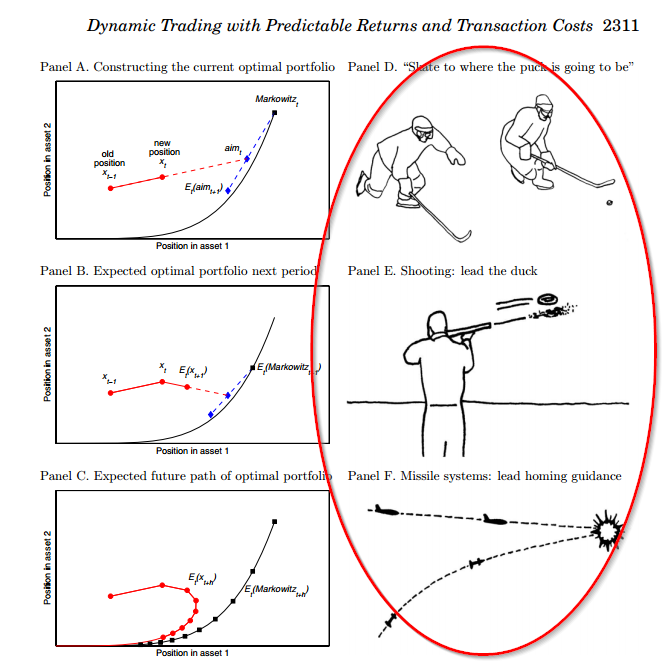
The figure depicts various portfolio optimizations under different assumptions and then has a visualization equivalent with hockey players, skeet shooters, and missile systems.
I’m not sure how many readers follow hard-core academic publications, but this is pretty wild. I’ve read 1000’s of academic finance papers and never seen anything like this.
I’m a fan.
Dynamic Trading with Predictable Returns and Transaction Costs
This paper derives in closed form the optimal dynamic portfolio policy when trading is costly and security returns are predictable by signals with different mean reversion speeds. The optimal updated portfolio is a linear combination of the existing portfolio, the optimal current portfolio absent trading costs, and the optimal portfolio based on future expected returns. Predictors with slower mean reversion (alpha decay) get more weight since they lead to a favorable positioning both now and in the future. We implement the optimal policy for commodity futures and show that the resulting portfolio has superior returns net of trading costs relative to more naive benchmarks. Finally, we derive natural equilibrium implications, including that demand shocks with faster mean reversion command a higher return premium.

About the Author: Wesley Gray, PhD
—
Important Disclosures
For informational and educational purposes only and should not be construed as specific investment, accounting, legal, or tax advice. Certain information is deemed to be reliable, but its accuracy and completeness cannot be guaranteed. Third party information may become outdated or otherwise superseded without notice. Neither the Securities and Exchange Commission (SEC) nor any other federal or state agency has approved, determined the accuracy, or confirmed the adequacy of this article.
The views and opinions expressed herein are those of the author and do not necessarily reflect the views of Alpha Architect, its affiliates or its employees. Our full disclosures are available here. Definitions of common statistics used in our analysis are available here (towards the bottom).
Join thousands of other readers and subscribe to our blog.