Capacity Analysis for Equity Funds
- Michael O’Neill,Camille Schmid and Geoffrey Warren
- Journal of Portfolio Management, Spring 2018
- A version of this paper can be found here
- Want to read our summaries of academic finance papers? Check out our Academic Research Insight category.
What are the Research Questions?
- What is a good definition of capacity?
- What are the determinants of capacity?
- What is a reasonable integrated approach to capacity analysis?
What are the Academic Insights?
The authors aim to research investment capacity and suggest a practical approach that captures the key drivers in an integrated analysis.
- The literature provides disparate definitions of capacity. The authors modify the definitions outlined by Vangelisti [2006], as such:
- Effective capacity: Amount of assets under management invested in an active strategy at which it is no longer possible to make additional investments that generate marginal alpha in excess of a minimum threshold.
- This definition focuses on alpha generation at the margin, identifying capacity as the AUM after which a fund earns alpha below a minimum acceptable level on an additional dollar invested. The alpha threshold represents the minimum alpha required by investors to cover the management fee and compensate for active risk. This threshold may vary with the nature of the fund investors, including their alpha requirements and the fee they pay; or across market segments, e.g. a higher alpha threshold might be imposed on small stocks in recognition of greater research costs or higher risk.
- The determinants of capacity are as follows: the number of opportunities available to the fund; the market segments from which opportunities are sourced; the alpha profile; the cost of executing trades; and any constraints on stock holdings or ability to participate in trades. Interestingly enough, the ability to trade with limited market impact, while important, is often less relevant than investors think in determining capacity limits of a strategy.
- The authors propose a solution within the class of predictive models that focuses on locating the optimal trade schedule for a given target or paper portfolio, which amounts to minimizing implementation shortfall (IS), at the intersection of work by Perold (1988) and Almgren and Chriss (2001). Their approach involves identifying the opportunities available to generate alpha, profiling the expected alpha arising from those opportunities, and then optimizing alpha capture subject to execution costs, holding constraints and trading constraint. See paper for a list of variable included and practical examples (e.g., a quantitative momentum strategy and a stock picking equity strategy).
Why does it matter?
A key message of this paper is that capacity analysis should focus on the point at which additional AUM is unable to be actively invested at a marginal alpha exceeding some minimum threshold – a quantity that the authors call ‘effective capacity’ – rather than focusing on total fund alpha. A fund may be generating substantial alpha from the opportunities in which it has already invested, yet be unable to generate sufficient marginal alpha on further AUM.
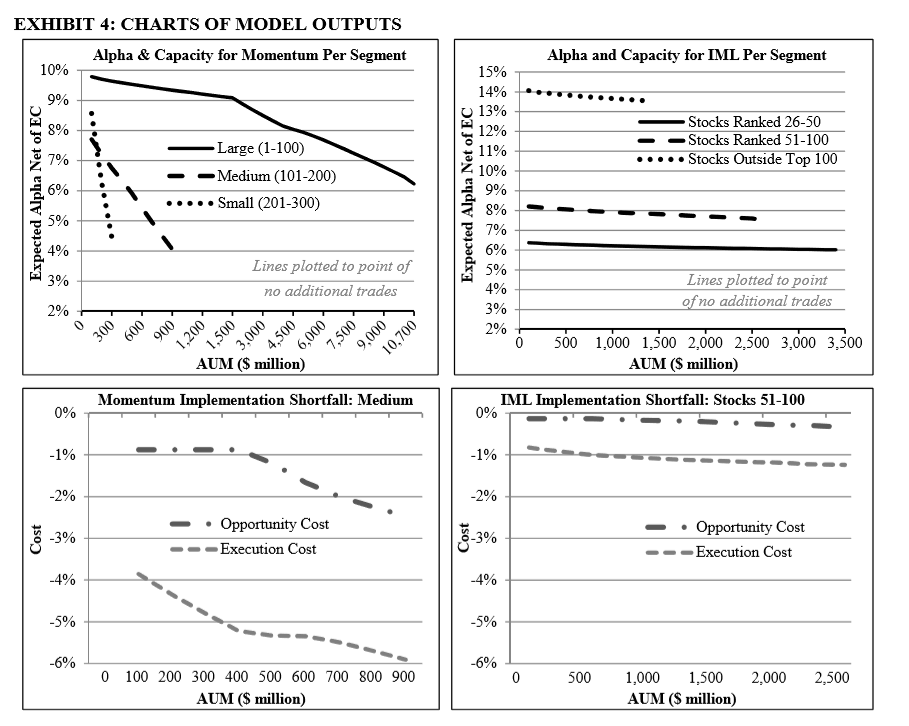
The Most Important Chart from the Paper
Exhibit 4 plots estimates at various levels of AUM. The top two charts plot expected alpha net of execution costs (EC) for each segment. The alpha plots reflect average net alpha, with the lines ending at the AUM where marginal net alpha falls to the threshold, hence indicating that effective capacity has been reached. For example, when the momentum strategy reaches effective capacity at $10.7 billion in the large stock segment, average alpha is in excess of 6% and marginal net alpha is 2%. The bottom two charts plot the execution cost (EC) and opportunity cost (O)C components of implementation shortfall (IS) for the medium stock segments.
The results are hypothetical results and are NOT an indicator of future results and do NOT represent returns that any investor actually attained. Indexes are unmanaged, do not reflect management or trading fees, and one cannot invest directly in an index.
Abstract:
This article discusses the definition and determinants of capacity and outlines a practical approach for analyzing the capacity of equity funds. It is argued that capacity analysis should focus on effective capacity, defined as the level of assets under management at which any additional investments would generate alpha below a minimum threshold at the margin, for the active component of a portfolio. The approach combines potential drivers into an integrated analysis and generates insight into the critical factors for the capacity of the strategy being analyzed. The approach is illustrated for a factor-based momentum strategy and an actual equity fund.
About the Author: Wesley Gray, PhD
—
Important Disclosures
For informational and educational purposes only and should not be construed as specific investment, accounting, legal, or tax advice. Certain information is deemed to be reliable, but its accuracy and completeness cannot be guaranteed. Third party information may become outdated or otherwise superseded without notice. Neither the Securities and Exchange Commission (SEC) nor any other federal or state agency has approved, determined the accuracy, or confirmed the adequacy of this article.
The views and opinions expressed herein are those of the author and do not necessarily reflect the views of Alpha Architect, its affiliates or its employees. Our full disclosures are available here. Definitions of common statistics used in our analysis are available here (towards the bottom).
Join thousands of other readers and subscribe to our blog.