Factor Momentum Everywhere
- Tarun Gupta and Bryan Kelly
- Journal of Portfolio Management
- A version of this paper can be found here
- Want to read our summaries of academic finance papers? Check out our Academic Research Insight category
What are the research questions?
The research presented here covers the largest number of factors (65) tested in the academic literature. The most robust and well-cited factors appear in the list of data items, available since the 1960s. A notable exclusion is the IBES dataset, which is available only in the 1980s.
- Is there persistence in factor returns?
- If so, can timing models based on autoregressive patterns work successfully for individual factors?
- Can a trading strategy be formed based on the individual factor timing strategies?
- Are the results subsumed by traditional risk adjustments and/or transactions costs?
What are the Academic Insights?
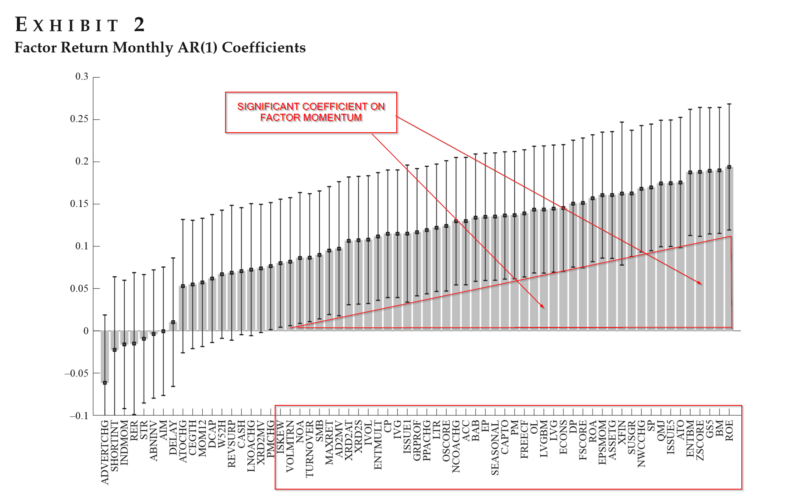
- YES. Individual factors display strong serial correlation. The authors fit an autoregressive process, AR(1), to each of the time-series for 65 factors. As reported in Figure 2 below, of the 65 US factors tested, 59 coefficients were positive and 6 were negative. Of the 59 positive factors, the coefficient was significant for 49 factors. None of the negative coefficients were reported as significant. The average coefficient on the autoregressive term, AR(1), the coefficient was .11.
- YES. A timing strategy was built that successfully exploited the relationship between the factor’s current period one month return and its’ own previous one month return. Each individual factor exposure at time t was adjusted proportionately and consistent with its t-1 one month return. The strategy produced a positive and significant alpha for 47 of the 65 factors. The benchmark was a passive investment in the unadjusted or raw factor. The authors reported an average IR of .33 overall 65 factors.
- YES. A second trading strategy was also tested, labeled TSFM, or time-series factor momentum. The TSFM takes the average of all individual factor models with the one-month lookback and a long-short portfolio is formed. TSFM delivered a Sharpe ratio of .84. It turned in stable performance when longer lookback periods were used, for example, .70 for 12-month, and .72 with 60-month lookback. Various other processes/formations of the lookback period were tested with similar results.
- NO. The TSFM outperformed two benchmarks created: (1) equal-weighted average of 65 raw factors; and (2) a traditional momentum portfolio created at the stock level (Asness, 1994). TSFM produced significant alphas beyond Benchmark (1) and was partially explained by Benchmark (2). When Fama French factors, industry momentum, short-term reversal, and transaction costs were taken into account, results did not change. The Sharpe ratios of TSFM remained superior. The analysis was also completed for international markets (Europe, Pacific, Canada) with similarly strong results. However, only 62 of the original 65 factors were included due to data restrictions.
Why does it matter?
This study is an interesting first effort at determining the feasibility of timing factors. Factor momentum appears to be in the historical data. The surprising thing is that it appears to have produced such successful outcomes. The paper should stimulate more research into a topic of wide interest to practitioners and academics. I definitely recommend that readers dig into the source document.
The most important chart from the paper
Abstract
In this article, the authors document robust momentum behavior in a large collection of 65 widely studied characteristic-based equity factors around the globe. They show that, in general, individual factors can be reliably timed based on their own recent performance. A time series “factor momentum” portfolio that combines timing strategies of all factors earns an annual Sharpe ratio of 0.84. Factor momentum adds significant incremental performance to investment strategies that employ traditional momentum, industry momentum, value, and other commonly studied factors. Their results demonstrate that the momentum phenomenon is driven in large part by persistence in common return factors and not solely by persistence in idiosyncratic stock performance.
About the Author: Tommi Johnsen, PhD
—
Important Disclosures
For informational and educational purposes only and should not be construed as specific investment, accounting, legal, or tax advice. Certain information is deemed to be reliable, but its accuracy and completeness cannot be guaranteed. Third party information may become outdated or otherwise superseded without notice. Neither the Securities and Exchange Commission (SEC) nor any other federal or state agency has approved, determined the accuracy, or confirmed the adequacy of this article.
The views and opinions expressed herein are those of the author and do not necessarily reflect the views of Alpha Architect, its affiliates or its employees. Our full disclosures are available here. Definitions of common statistics used in our analysis are available here (towards the bottom).
Join thousands of other readers and subscribe to our blog.