Prior Research on Value and Profitability Factors
The 1997 publication of Mark Carhart’s paper “On Persistence in Mutual Fund Performance” led to the four-factor model, which added momentum to market beta, size, and value, becoming the workhorse model in finance—replacing the Fama-French three-factor model. The next major contribution came from Robert Novy-Marx. His 2013 paper “The Other Side of Value: The Gross Profitability Premium – (Summary)” not only provided investors with new insights into the cross-section of stock returns, but also helped further explain some of Warren Buffett’s superior performance.
Novy-Marx’s study built upon a 2006 paper, “Profitability, Investment and Average Returns,” Summary by Eugene Fama and Kenneth French, who showed that firms with high profitability measured by earnings have high subsequent returns after controlling for book-to-market ratio and investment. And as is the case with other factors, profitability had been used for decades by practitioners such as Benjamin Graham and David L. Dodd. Novy-Marx’s work investigated gross profits, defined as sales minus the cost of goods sold, over the period from 1962 through 2010. The following is a summary of his findings:
- Profitability, as measured by the ratio of gross profits to assets, has roughly the same power as the book-to-market ratio (a value measure) in predicting the cross-section of average returns.
- Surprisingly, profitable firms generated significantly higher returns than unprofitable firms, despite having significantly higher valuation ratios (for instance, higher price-to-book ratios).
- Profitable firms tend to be growth firms, meaning they expand comparatively quickly. Gross profitability is a powerful predictor of future growth as well as earnings, free cash flow, and payouts.
- The most profitable firms earn returns 0.31 percent per month higher on average than the least profitable firms. The data are statistically significant, with a t-statistic of 2.49.
- The abnormal return (alpha) of the profitable-minus-unprofitable return spread relative to the Fama–French three-factor model is 0.52 percent per month, with a t-statistic of 4.49.
- The returns data are economically significant, even among the largest, most liquid stocks.
- Gross profitability has far more power in predicting the cross-section of returns than earnings-based measures of profitability.
- High asset turnover (defined as sales divided by assets, an accounting measure of operating efficiency) primarily drives the high average returns of profitable firms, while high gross margins are the distinguishing characteristic of “good growth” stocks.
- Controlling for profitability dramatically raises the performance of value strategies, especially among the largest, most liquid stocks. Controlling for the book-to-market ratio improves the performance of profitability strategies. Controlling for profitability provides less help for other value strategies because while book-to-market is negatively correlated with profitability, other value metrics (such as price-to-cash flow and enterprise value-to-EBTID) are positively correlated with profitability.
- While the more profitable growth firms tend to be larger than less profitable growth firms, the more profitable value firms tend to be smaller than less profitable value firms.
- Strategies based on gross profitability generate value-like average excess returns, even though they are actually growth strategies.
- Because both gross profits-to-assets and book-to-market ratios are highly persistent, the turnover of both the profitability and value strategies is relatively low.
- Strategies built on profitability are growth strategies, so they provide an excellent hedge for value strategies. Adding profitability on top of a value strategy reduces the strategy’s overall volatility.
This last point provided insight into a strategic way to implement a value strategy. The monthly average returns for the profitability and value strategies were 0.31 percent and 0.41 percent per month, respectively, with standard deviations of 2.94 percent and 3.27 percent, respectively. However, an investor running the two strategies together would capture both strategies’ returns, 0.71 percent per month, but would face no additional volatility risk. The monthly standard deviation of the joint strategy, despite having long/short positions twice as large as those of the individual strategies, is only 2.89 percent because the two strategies’ returns have a correlation of –0.57 over the sample. While both factors add to returns, this negative correlation means the two factors tend to work at different times, producing the lower volatility. The t-statistic on the average monthly returns for the mixed profitability/value strategy is 5.87, and its realized annual Sharpe ratio is 0.85 — two-and-a-half times the 0.34 Sharpe ratio of the overall market over the same period.
As further evidence that the two strategies combine well, consider the following: While both the profitability and value strategies generally performed well over the full sample period, both had significantly long periods in which they lost money. Profitability performed poorly from the mid-1970s to the early 1980s and over the mid-2000s. During these periods, value performed very well. On the other hand, value performed poorly over the 1990s and also in the most recent period from January 2017 through March 2020. During these periods, profitability performed well. For example, from January 2017 through March 2020, when the value factor experienced its largest drawdown ever, almost 60 percent, the profitability factor provided a positive return of about 10 percent. In other words, profitability generally performed well in the periods when value performed poorly, and vice versa—showing the benefits of diversification and of combining factors.
New Research on Value and Profitability Factors
Sunil Wahal and Eduardo Repetto contribute to the literature with their June 2020 study “On the Conjoint Nature of Value and Profitability.” They analyzed how combining the two strategies, tilting exposure to the two factors, in long-only portfolios impacted the risk and return of a portfolio. They begin by noting:
“Using the joint distribution is conceptually quite different from investing in a value portfolio with a profitability screen, or vice versa. It is also different from investing in a value portfolio and a high relative profitability portfolio simultaneously. This is because value stocks need not be high profitability stocks and vice-versa, and/or because the weights ascribed to stocks in a value-only or profitability-only portfolio are not the same as weights in a joint value and profitability portfolio.”
The building block for their portfolios consists of 4×4 grids of value and profitability portfolios, using book-to-market ratios and operating profitability to construct portfolios. They perform independent sorts on value and profitability, forming portfolios at the end of each June and rebalancing annually. All portfolio returns are value-weighted. Their data sample covers the 80-year period 1940-2019. The following table shows the average market capitalization weights by quartile of value and profitability portfolios over the 80-year period.
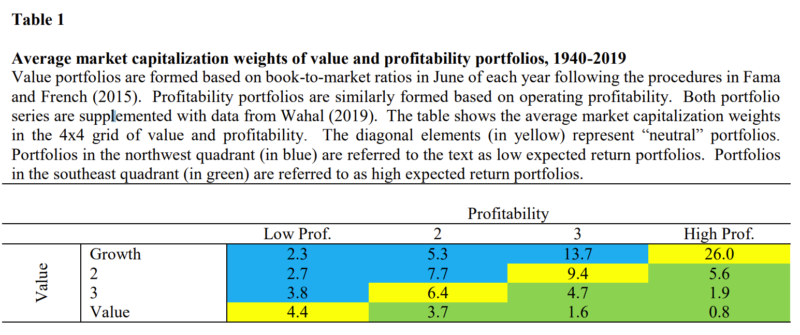
The blue stocks are the ones with low expected returns, the green stocks are the high expected returning stocks, and the Yellow indicates neutral stocks (stocks with the same expected return as the market portfolio). While the highest expected returning stocks make up less than 1 percent of the total market capitalization, creating problems of trading costs and scalability, the green stocks in aggregate total about 18 percent of the market capitalization, providing plenty of capacity to implement a joint value/profitability portfolio. Also note that the blue stocks, the low expected returning stocks make up about 36 percent of the aggregate market cap. The yellow stocks, which make up 46 percent of the market portfolio, have similar returns to the market. Of the remaining 54 percent of the stocks (those in blue and green) the green ones with high profitability/high book-to-market represent 35 percent and the blue ones with low profitability/low book-to-market 65 percent.
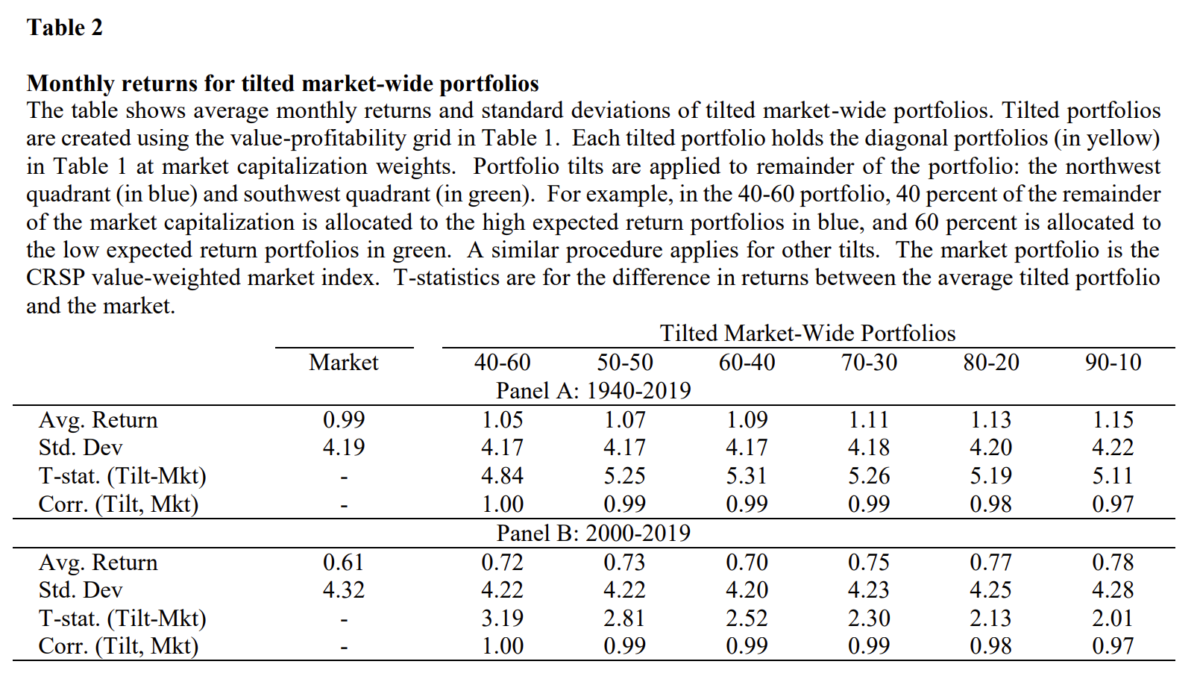
To provide greater exposure to the value and profitability factors Wahil and Repetto built “tilted” portfolios—overweighting the most profitable stocks. The tilted portfolios keep the stocks in the 46 percent yellow diagonal constant and allocate the remaining 54 percent different than the market. The market has 35 percent in high profitability /high book-to-market stocks and they increase that share to 40 percent, 50 percent, 60 percent, 70 percent, 80 percent, and 90 percent so that the most tilted portfolio will be 46 percent in the market portfolio and 90 percent of the remaining 54 percent in high profitability/high book-to-market, and 10 percent of 54 percent in low profitability/low book-to-market stocks.
Within the portfolios, market cap weighting was maintained by rescaling (allowing individual security weights to not be too large and portfolio capacity to remain high). The procedure was repeated for 50/50, 60/40. 70/30, 80/20, and 90/10 tilts. Following is a summary of their findings:
- The average monthly returns to tilted market portfolios are higher than a pure market portfolio over the 1940-2019 period with about the same, or slightly lower, level of volatility.
- Over the full period, performance improved monotonically as the tilts increased—from a modest six basis points per month for the 40/60 portfolio to 16 basis points per month for the 90/10 portfolio. The correlations with the market portfolio were 100 percent for the 40/60 portfolio, declining only slightly to 0.97 for the 90/10 portfolio. The data was highly significant with t-stats of about 5. Over the most recent 20-year period, the improvements increased from 11 basis points for the 40/60 portfolio to as much as 17 for the 90/10 portfolio. Given the shorter period, the t-stats were lower, but all were significant at the 5 percent confidence level.
- Even in periods where value has underperformed growth (2000-2019), tilted portfolios outperform market portfolios by similar magnitudes—by providing exposure to value and profitability, as evidenced by factor loadings on three- and five-factor models.
- Bootstrap simulations over a variety of longer holding periods (1, 3, 5, 10, 20, and 30 years) show both that the percentage of holding periods with negative payoffs is lower for tilted portfolios than for the market and that the distribution of payoffs shifts slightly further to the right—the distribution of outcomes for long-only investors with longer horizons are significantly improved.
Wahil and Repetto concluded:
“From a portfolio perspective, the devil is in the engineering details: recognizing that value and profitability are linked allows one to target the premiums more efficiently while being cognizant of trading costs, portfolio capacity, and other such issues of practical import. The results suggest that long-only investors can benefit from properly designed portfolios, especially if their horizons are long.”
The research demonstrating the benefits of combining value and profitability (as well as combining value and momentum or all three) has led fund families such as AQR, Alpha Architect, Avantis, Black Rock, and Dimensional to incorporate the strategy into portfolio construction design.
About the Author: Larry Swedroe
—
Important Disclosures
For informational and educational purposes only and should not be construed as specific investment, accounting, legal, or tax advice. Certain information is deemed to be reliable, but its accuracy and completeness cannot be guaranteed. Third party information may become outdated or otherwise superseded without notice. Neither the Securities and Exchange Commission (SEC) nor any other federal or state agency has approved, determined the accuracy, or confirmed the adequacy of this article.
The views and opinions expressed herein are those of the author and do not necessarily reflect the views of Alpha Architect, its affiliates or its employees. Our full disclosures are available here. Definitions of common statistics used in our analysis are available here (towards the bottom).
Join thousands of other readers and subscribe to our blog.