A firm’s stock price should reflect the value of both its tangible and intangible capital. While tangible capital has been widely studied, intangible capital has been receiving more attention due to its increasing importance in economic values. According to a December 29, 2020, Forbes article, “In 1975, less than 20% of the S&P 500’s market value was derived from intangible assets such as patents or proprietary technology. Fast forward 45 years, and today approximately 90% of the S&P 500’s market value is considered intangible.” Clearly, intangibles have become important in determining the market value of companies.
Xin Liu, Chengxi Yin, and Weinan Zheng, authors of the study “The Invisible Burden,” published in the January 2021 edition of the Journal of Financial Markets, examined whether goodwill is efficiently priced (see old post on the subject). Their hypothesis was that because the fair value of goodwill is not observable and is hard to accurately evaluate even for professional accountants, let alone general investors, it could be mispriced, especially where limits to arbitrage allow for those with more optimistic views to have a greater influence on prices.
They began by noting that goodwill is the largest component of intangible capital:
“The total dollar value of goodwill in the U.S. stock markets has increased from $200 billion in 1989 to nearly $5 trillion in USD, and consists of about 60 percent of total intangible assets.”
Goodwill arises when one firm acquires another. The authors explained:
“It is measured as the difference between the acquisition cost and the fair market value of the target’s identifiable tangible and intangible net assets. It may represent the premium paid by the acquirer for the target’s resources (such as reputation, customer loyalty), as well as the expected synergy generated by the firm’s components.”
They added:
“A high level of goodwill does not necessarily guarantee optimistic future cash flows.”

To determine if goodwill is efficiently priced, they used net sales as a proxy for cash flows and calculated goodwill-to-net sales (GTS) for all firms with positive goodwill on their balance sheet(1).
To take into account the variations of GTS in different industries, they used Fama-French’s 38 industry classifications. They computed industry-adjusted GTS (GTS_adj) as the difference between a firm’s GTS and its industry mean GTS. Their data sample included all NYSE, AMEX, and Nasdaq firms that were covered in the Center for Research in Security Prices (CRSP) and Compustat that had prices above $5, positive goodwill, and a market capitalization higher than the bottom NYSE size decile. The sample covered the period 1989 to 2016.
Following is a summary of their findings:
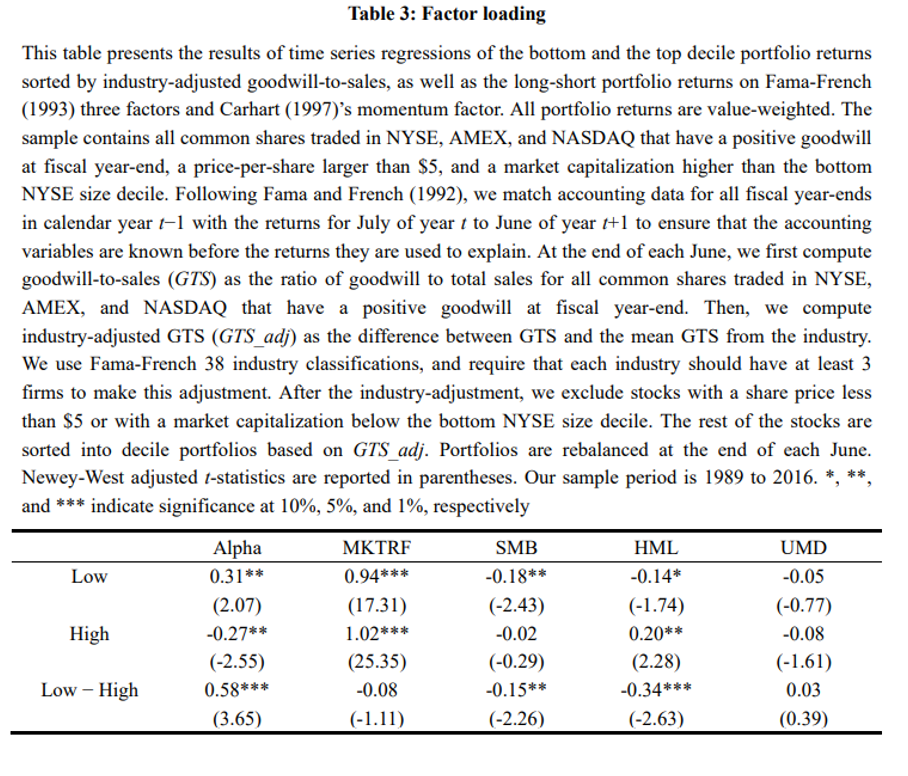
- A value-weighted long-short portfolio that bought stocks from the lowest GTS_adj decile and sold stocks from the highest GTS_adj decile earned an economic and statistically significant four-factor adjusted monthly return of 0.58% (t-stat = 3.65).
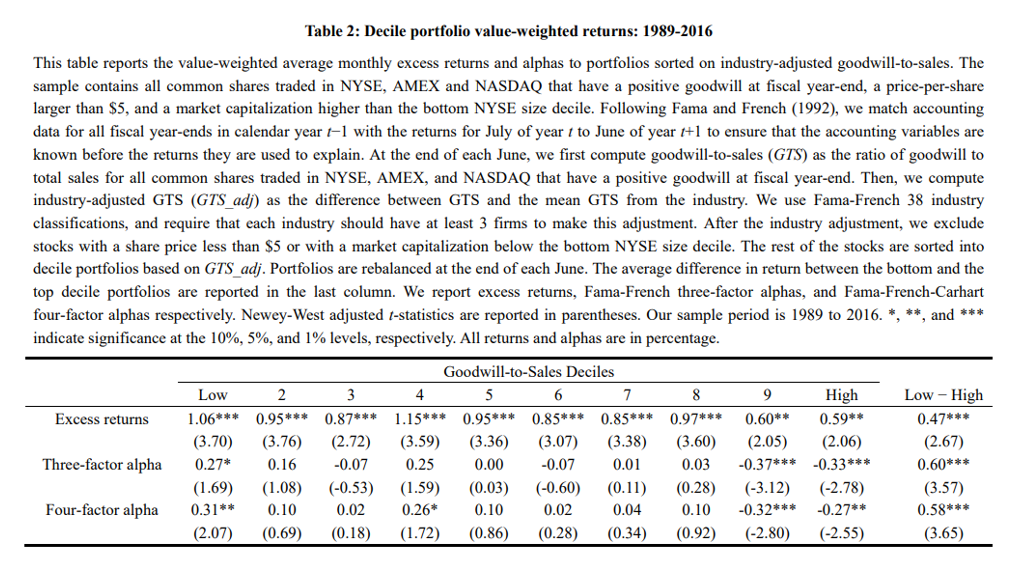
- Four-factor alpha dropped as GTS_adj increased—the four-factor alpha for the bottom decile portfolio was 0.31% (t-stat = 2.07) per month and became -0.27% (t-stat = -2.55) for the top GTS_adj decile.
- Robust results were obtained after adjustment by other common factor models, such as the Fama-French five factors, Hou-Xue-Zhang q-factors, and Stambaugh-Yuan mispricing factors.
- A high GTS ratio leads to high goodwill impairment and low profitability in the subsequent fiscal year—a high GTS significantly and negatively predicts future earnings surprises, confirming that a high GTS ratio contains negative information on future firm value. Investors underreact to the information associated with GTS, and the stock price slowly adjusts to reflect the true value of the firm.
- The results were not driven by small firms, as they excluded stocks priced below $5 and market capitalization below the bottom NYSE size decile. The median NYSE size percentile in their sample was about 40 percent. However, the results were stronger for firms with a low level of investor attention (such as smaller firms, firms with low analyst coverage, and firms with low institutional ownership) and firms with high idiosyncratic volatility.
- The negative relation between GTS_adj and subsequent stock returns exists only among firms with recent cross-industry M&As—the hypothesis is that evaluating goodwill from a cross-industry merger and acquisition (M&A) deal can be substantially more complicated.
- The predictive power of GTS_adj was the strongest in Quarter 1 after the portfolio formation monotonically declined over time and became statistically insignificant after three quarters.
- The results hold up to tests of robustness using total assets and net income, and when they exclude firms with recent mergers and acquisitions, as well as other tests.
Because of the 2001 change in accounting rules regarding goodwill (in the pre-2001 period), it was amortized over a lifetime not to exceed 40 years; in the post-2001 period, goodwill is no longer amortized but is subject to an annual review for impairment based on future cash flows. I asked the authors if they had performed a test of robustness. They informed me that they had done so and found that their results held both in the pre-2001 subsample and the post-2001 subsample, suggesting that their “results may not be mainly driven by a particular regime switch in the accounting of goodwill, but reflects a general market phenomenon.”
Liu, Yin, and Zheng’s findings led them to conclude that the negative return predictability of goodwill is due to the fact that investors underreact to the negative information on the firm value associated with high goodwill. Perhaps the publication of their paper will lead to at least a reduction in the size of the anomaly, as their findings were not limited to small firms where limits to arbitrage can allow mispricings to persist.
Liu, Yin, and Zheng also concluded that bad M&A deals have a long-term negative impact on acquirers, especially for firms with cross-industry M&As and overconfident CEOs. They used four metrics identified in the study “Executive Overconfidence and the Slippery Slope to Financial Misreporting” to determine overconfidence, and cited prior research findings that:
“Overconfident CEOs are more likely to make optimistic and less accurate forecasts, delay loss recognition, adopt more aggressive accounting methods, conduct earnings management, and engage in financial statement fraud.”
When considering Liu, Yin, and Zheng’s findings, it’s important to understand that goodwill differs from internally generated intangible capital (R&D is expensed and thus does not appear on the balance sheet). Research papers, including the 2020 studies “Intangible Capital and the Value Factor: Has Your Value Definition Just Expired?” and “The R&D Anomaly: Risk or Mispricing?” have found that capitalizing past R&D expenses (creating an adjusted book-to-market value) improves the explanatory power of the value factor, improving outcomes for multifactor investors, and also aligns with risk-based explanations. (see here fore more background)
Finally, it will be interesting to see if Liu, Yin, and Zheng’s findings lead systematic money managers to use GTS when evaluating stocks, avoiding stocks with a high GTS because this high level of goodwill may not be well justified by realized cash flows.
Disclosures
Important Disclosure: The information contained in this article is for educational purposes only and should not be construed as specific investment, accounting, legal or tax advice. The analysis contained in this article is based upon third party information available at the time which may become outdated or otherwise superseded at any time without notice. Certain third-party information is based upon is deemed to be reliable, but its accuracy and completeness cannot be guaranteed. By clicking on any of the links above, you acknowledge that they are solely for your convenience, and do not necessarily imply any affiliations, sponsorships, endorsements or representations whatsoever by us regarding third-party websites. We are not responsible for the content, availability or privacy policies of these sites, and shall not be responsible or liable for any information, opinions, advice, products or services available on or through them. The opinions expressed by featured authors are their own and may not accurately reflect those of the Buckingham Strategic Wealth®, Buckingham Strategic Partners® (collectively Buckingham Wealth Partners). LSR-21-32

References[+]
| ↑1 | When I asked the authors why they chose sales instead of cash flow, they responded: “Sales is a direct and intuitive way to capture cash flow, and also clean in the sense that it is less likely to be affected by different accounting standards, or different ways to compute cash flow. From a technical perspective, we need a denominator that does not have a return prediction. Therefore, we use sales as the denominator for our sorting variable.” |
|---|
About the Author: Larry Swedroe
—
Important Disclosures
For informational and educational purposes only and should not be construed as specific investment, accounting, legal, or tax advice. Certain information is deemed to be reliable, but its accuracy and completeness cannot be guaranteed. Third party information may become outdated or otherwise superseded without notice. Neither the Securities and Exchange Commission (SEC) nor any other federal or state agency has approved, determined the accuracy, or confirmed the adequacy of this article.
The views and opinions expressed herein are those of the author and do not necessarily reflect the views of Alpha Architect, its affiliates or its employees. Our full disclosures are available here. Definitions of common statistics used in our analysis are available here (towards the bottom).
Join thousands of other readers and subscribe to our blog.