Not long ago, GameStop stock rose like crazy in only a few hours with the effects of broker-dealer options hedging spurred by retail investor buying pressure. And from February to March 2020, options trading activity was also pointed to as a contributor to stock swings in the Covid-19 selloff. The market dropped 30% and then recovered quickly over the following weeks.
It has been documented that the need for market makers to hedge their positions with options (given rapid changes in stock prices) can contribute to market and stock price swings. However, might there be other factors also at play in these types of stock and market fluctuations?
What Factors Contribute to Stock & Market Swings?
This was the question that researchers Heiner Beckmeyer, University of Munster; Andrea Buraschi, Imperial College; Mathis Moerke, University of St. Gallen, and I pondered upon publishing our 2020 paper on Gamma Fragility. In that paper, we documented a link between large aggregate dealers’ gamma imbalances and intraday momentum and reversal of stock returns, using OptionMetrics data. While examining how hedging by options market makers can impact stock market prices, we wondered about another financial instrument that could lead to similar impacts on stock prices. We examine this instrument further in our most recent paper entitled, The Role of Leveraged ETFs and Option Market Imbalances on End-of-Day Price Dynamics.
The use of leveraged ETFs (exchange traded funds) has been on the rise over the past several decades. Many like the instrument’s ability to offer even more diversified exposure over traditional ETFs, as well as their ability to amplify returns of an underlying index. Leveraged ETFs offer investors the ability to double or triple securities in the underlying, versus having a one-to-one relationship with them, as with traditional ETFs. Institutional investors may also use leveraged ETFs to hedge other trades. For instance, if a hedge fund manager speculates that a specific stock is overpriced, they could short the stock, but in so doing, they may be exposed to the market reach. So, they may instead short the stock and take a position with a leveraged ETF with a negative average factor (short the market and go long the stock), thereby hedging systematic risk.
In our most recent research, we examine the combined effects of leveraged ETFs and options trading on stocks and the market. We are the first to compare these effects individually and together. We find that only in accounting for both (options hedging and leveraged ETFs) are investors able to get a more complete understanding of what is happening in the markets. And, in fact, this combined information can be used to predict if a given stock will go up or down in the last 30 minutes of the trading day.
To arrive at our conclusions, our team put together a database on options holdings from 2010 to 2020. We merged data from CBOE and three NASDAQ options exchanges with OptionMetrics, and also added information on stocks from CRSP (Center for Research in Security Prices), on which to run our analysis. OptionMetrics offers open interest for every option broken down by integrities of investors. It also offers Greeks of options and breakdowns of global open interest, readily available out-of-the-box, which is a huge time-saver.
Because options are in zero supply (for every person holding an option there is another person/institution selling that option), one may think that the effects should cancel out. However, since only a subset of investors are engaged in delta-hedging, the net effect can be non-trivial. We think it is fair to assume retail investors are not engaging in delta hedging and instead buy options for directional view (if they are bullish, they buy a call option; if they are bearish, they buy a put option), whereas market makers buy to hedge or stay neutral, versus investing for exposure. In order to measure the expected price pressure of delta hedging, we assessed the trades of the two investor groups (retail versus institutional traders) with open interest for options divided by investors’ integrity, or the number of options bought or sold by retail investors.
Next, we measured the quantity, or the net gamma imbalance, of delta hedgers. We derive this measurement (mathematically by taking the gamma-weighted average of the options inventory of delta-hedgers). We then used our database to construct the most relevant proxy for that mathematical quantity and empirically build our measure. We formulated our empirical hypothesis on how volumes created by delta hedging impact stock prices. We developed implications of our hypothesis that can be tested on the data and directly test implications with more sophisticated statistical techniques.
Two Key Mechanisms
Our findings show that both delta-hedging and leveraged ETF rebalancing exert economically large price pressure on end-of-day returns. However, where leveraged ETFs contribute to a market-wide momentum effect, delta-hedging can either have a stabilizing effect in the form of end-of-day reversal or exaggerate intraday momentum. The direction is determined by the previous return of the underlying and aggregate option inventory of market makers.
We also found that while options market makers have discretion on the execution of their hedging strategies, providers of leveraged ETFs (or total return swaps) have to rebalance their position at the end of each trading day. This is because they need to buy/sell a specific stock to continue to deliver expected returns before the end of the day. Consider an ETF that is two times, meaning it is leveraged with a factor of two to always deliver two times the return of the index it is tracking. To deliver this return as promised, the broker-dealer needs to enter a contract with a counterparty to buy twice the quantity of total return swaps of the specific stock at the end of the day. But, if during the day, the value of the index they are tracking is rising, they need to buy even more swaps to help to ensure double the return of the index the next day. Whenever the index goes up, the broker-dealer has to buy additional return swaps, and the counterparty offering the return swaps has to buy the stock. This process can put a lot of pressure on the stock, causing the price to jump up or down.
We find that both rebalancing effects—options and leveraged ETFs—are mechanical and do not impound new fundamental information into prices. The effects are also quickly reverted at the next day’s open.
Stock Price Predictability
While options delta-hedging and leveraged ETF rebalancing are different mechanisms, they share the same potential to contribute to swings in stock prices and the market. And, when examined together, delta hedging and broker-dealer rebalancing may also increase the predictability of stock prices at the end of the day.
For instance, on some days, because of activity in the options markets, we know that broker-dealers have to buy specific stocks, and we may expect the price of them to go up at end of the day as a result. On others, they may have to sell stocks, and one would expect these stock prices to go down as a result. We may expect similar effects for leveraged ETFs.
However, if we put these mechanisms together, we may see that in those days where both delta hedging and broker-dealer rebalancing are positive, the stock price may go up considerably. And in other days the effects—from the positive (negative) pressure from leveraged ETFs and the negative (positive) pressure from option gamma—may cancel each other out and, thereby, the net pressure may be about zero. If one were to only look at options (or just leveraged ETFs), one might miss the respective pressure from each in hedging for a stock on a given day.
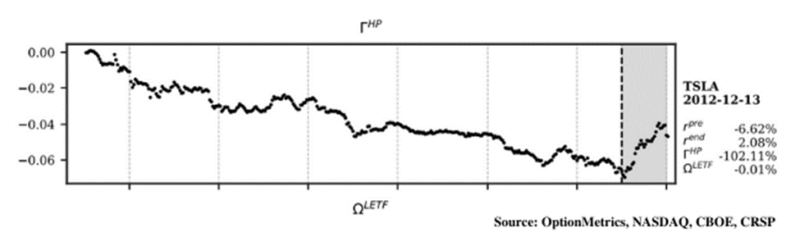
An example of the rebalancing effects, caused by options market makers and leveraged ETFs towards the end of the trading day, can be seen in this intraday return path for Tesla stock on December 13, 2012. At the beginning of the day, the aggregate gamma was positive and economically significant. During the day, Tesla experienced a negative return equal to −6.62% until 3:30 pm. The gamma imbalance implied that delta-hedgers needed to trade an amount equal to 102.11% of the average dollar trading volume of Tesla shares in the last half hour. A strong price reversal emerged in the last 30 minutes of the trading day, consistent with the large initial positive gamma imbalance.
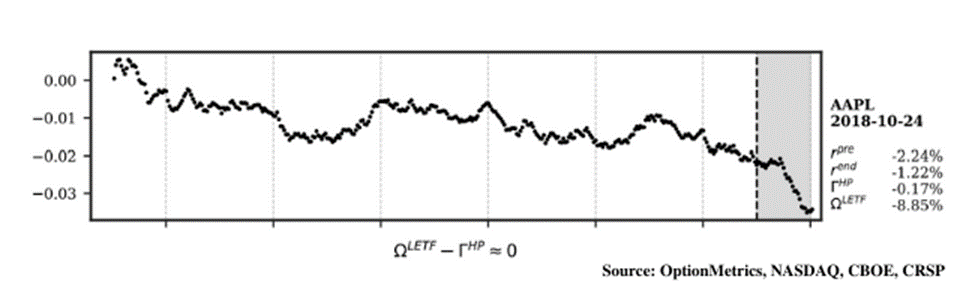
An important stock for leveraged ETFs is Apple. An interesting example provided by the dynamics of this stock on October 24, 2018, shows how Apple shares dropped by −2.24% and, as a consequence, broker-dealers with leveraged ETFs had to sell large quantities of Apple shares to rebalance portfolios of leveraged swaps for an estimated dollar amount equal to 8.85% of the average dollar daily trading volume in Apple shares. Possibly, as a result, the price dropped further by −1.22%.
Applying this Analysis to the Markets
We believe these findings should be interesting for investors and regulators on several fronts.
For investors with hedge funds, this information can provide greater awareness of how the markets operate, as well as, potentially, offer insights into profit opportunities. For instance, if investors are unaware of this mechanism, they may run from the market as it experiences a big drop, versus being aware that investing can bring the underpriced up again.
Additionally, this information may provide insights into investing opportunities. If investors can predict the direction of a stock in the last 30 minutes of the trading day, they can trade on that information. In our paper, we show a simple trading strategy that involves observing indices, and their constituents, to potentially deliver higher returns.
Regulators may also benefit from information on the dynamics in options and leveraged ETFs and how they might impact stock prices and markets. For instance, it may be beneficial to know that if the SPX drops during the day because of negative fundamental news and selling pressure from leveraged ETFs, selling pressure from leveraged ETFs could further amplify that drop. The chair of the Securities and Exchange Commission made a statement a few months ago about the concern that leveraged ETFs could be a source of instability for financial markets. One consideration might be to limit the AUM (assets under management) of leveraged ETFs or to put a cap on asset management of these investments to reduce their impact.
In summary, many factors can contribute to swings in the market. Our findings reveal the importance of assessing the effects of both options delta hedging and leveraged ETFs on stocks and markets. The rebalancing of leveraged ETFs by broker-dealers can amplify upward or downward movement in stocks in the last 30 minutes of trading. And hedging by options market makers can further boost these effects. Therefore, it is important for investors to assess both of these mechanisms together to more fully understand the markets.
About the Author: Andrea Barbon
—
Important Disclosures
For informational and educational purposes only and should not be construed as specific investment, accounting, legal, or tax advice. Certain information is deemed to be reliable, but its accuracy and completeness cannot be guaranteed. Third party information may become outdated or otherwise superseded without notice. Neither the Securities and Exchange Commission (SEC) nor any other federal or state agency has approved, determined the accuracy, or confirmed the adequacy of this article.
The views and opinions expressed herein are those of the author and do not necessarily reflect the views of Alpha Architect, its affiliates or its employees. Our full disclosures are available here. Definitions of common statistics used in our analysis are available here (towards the bottom).
Join thousands of other readers and subscribe to our blog.