Supply Chain Climate Exposure
- Kate Liu, Greg Hall, Lukasz Pomorski and Laura Serben
- AQR Quarterly Report, 2Q 2022
- A version of this paper can be found here
- Want to read our summaries of academic finance papers? Check out our Academic Research Insight category
What are the Research Questions?
In a previous post, the background and motivation for constructing an estimate for Scope3 emissions are discussed. Scope 3 is intended to account for emissions tied to a firm’s products and services. However, the SEC failed to define Scope 3 in terms of materiality. In answer to this opportunity, the authors of this paper developed and validated an approach to improve the measurement of supply chain climate exposure. In this summary, the focus of this paper is on the validation of the AQR Supply Chain Climate exposure measure using generally accepted methods.
Theoretically, the accounting for Scope 3 emissions is related to a company’s products and services and includes the product-specific emissions from the suppliers and customers of the company. In comparison, the AQR Supply Chain Climate Exposure measure for a company presented in this article includes (1) the overall emissions ( climate exposure) for suppliers in terms of the cost of supplies; (2) the overall emissions (climate exposure) for customers in terms of revenue. In this way, the strength of the economic links between the company and the emissions of its customers and suppliers is quantified.
The measure is a simple revenue-weighted climate exposure (C) where C is the sum of a sum of Scope 1(1) and Scope 2(2) associated with a customer of a specific firm. If a supplier, then the measure would be the supply cost-weighted value of C for the supplier.
Although the underlying rationale for the Supply Chain Climate Exposure measure is intuitively appealing, the authors conduct 3 empirical tests to bolster its validity with data:
- Correlation to third-party climate metrics;
- Correlation between the measure with climate sentiment;
- Determine the price impact relative to significant macro-level climate news.
What are the Academic Insights?
- Correlation to third-party climate metrics. The relationship between the AQR supply chain climate exposure and Scope 1,2,3 obtained from Trucost and MSCI (E-pillar, climate change theme, and Low Carbon Transition (LCT) scores), was analyzed and produced the expected results in most cases. Firms with high carbon emission intensity (especially scopes 1 and 3) exhibited higher supply chain climate exposures obtained from AQR. Higher exposures on the supply chain measure were related to lower environmental (E-pillar) scores, lower climate change theme scores, and lower LCT scores. One caveat: data limitations in the set of independent variables were especially severe at only 6 quarterly observations for climate change theme scores and LCT scores, versus 51 quarters for the remaining variables. The correlational relationship expressed in R-square terms ranged from 1% to 30%. The reader should be cautioned that although the numbers are low, at least some information regarding climate risk is captured. Recall that a value of 100% for R-square would suggest that the AQR measure overlaps completely with the data offered by other vendors. Nothing new to see there!(3) The best interpretation of the 30% R-square is that the relationship between the AQR measure and third-party measure is an imperfect one but it is not zero.
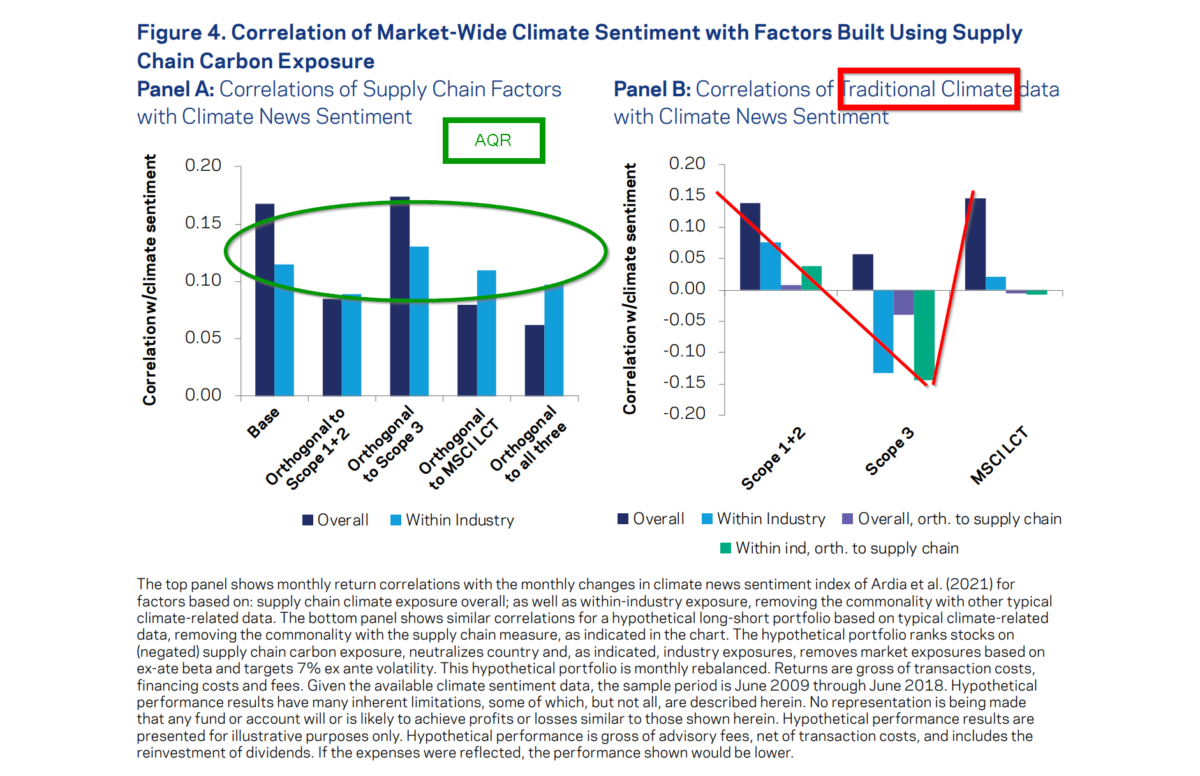
- Correlation with climate news sentiment. The relationship between the measure of supply chain climate exposure is positively related to climate news sentiment with a correlation between 0.15 and 0.20. Effectively, this means that “green” stocks outperform “brown” stocks during times when climate concerns are heightened, which provides additional validation to the AQR supply chain as a measure of climate risk. Although the correlations are low, the authors argue that the AQR supply chain climate exposure measure contains information important to the market in the climate context.
- Market reaction to macro-level climate change news. The market reaction of firms in high and low supply chain carbon exposure portfolios was assessed relative to two major climate events: (1) on 7/9/2009, the G8 committed to reducing greenhouse gas emissions by 80% –a positive climate event; and (2) on 6/1/2019, President Trump exited the US from the Paris Agreement –a negative climate event. The results were somewhat consistent with expectations. For the positive event, the “brown” firms exhibited negative excess returns and “green” firms exhibited mixed excess returns. For the negative event, the “green” firms exhibited pronounced negative excess returns. One caveat: only two events were presented whereas a stronger case would be made if more climate events were included.
Why Does it Matter?
I agree with the argument the authors make: The authors argue that the validation results reported here are unavoidably circumstantial. The quality of the third-party data is unquestioned even given the “noisiness” of the estimation process employed by each vendor. It is difficult to deny that the AQR measure captures a portion of climate-related information similar to the traditional measures from MSCI and Trucost. Finally, the predominance of the evidence is sufficient to recommend the use of the AQR supply chain climate exposure measure when analyzing securities and portfolios.
The Most Important Chart from the Paper
Abstract
To manage climate risks, investors need reliable climate exposure metrics. This need is particularly acute for climate risks along the supply chain, where such risks are recognized as important, but difficult to measure. We propose an intuitive metric that quantifies the exposure a company has to customers, or suppliers, who may in turn be exposed to climate risks. We show that such risks are not captured by traditional climate data. For example, a company may seem green on a standalone basis, but may still have meaningful, and potentially material, climate risk exposure if it has customers, or suppliers, whose activities could be impaired by transition or physical climate risks. Our metric is related to scope 3 emissions and may help capture economic activities such as emissions offshoring. However, while scope 3 focuses on products sold to customers and supplies sourced from suppliers, our metric captures the
strength of economic linkages and the overall climate exposure of a firm’s customers and suppliers. Importantly, the data necessary to compute our measure is broadly accessible and is arguably of a higher quality than the currently available scope 3 data. As such, our metric’s intuitive definition and transparency may be particularly appealing for investors.

References[+]
| ↑1 | Scope 1 are direct GHG emissions from owned sources |
|---|---|
| ↑2 | Scope2 are indirect GHG emissions from purchased and used heat, cooling, electricity, steam, etc. |
| ↑3 | If the value was very low (0%), it would suggest that the AQR measure had no correlation with climate-related issues at all. Again nothing to see there. |
About the Author: Tommi Johnsen, PhD
—
Important Disclosures
For informational and educational purposes only and should not be construed as specific investment, accounting, legal, or tax advice. Certain information is deemed to be reliable, but its accuracy and completeness cannot be guaranteed. Third party information may become outdated or otherwise superseded without notice. Neither the Securities and Exchange Commission (SEC) nor any other federal or state agency has approved, determined the accuracy, or confirmed the adequacy of this article.
The views and opinions expressed herein are those of the author and do not necessarily reflect the views of Alpha Architect, its affiliates or its employees. Our full disclosures are available here. Definitions of common statistics used in our analysis are available here (towards the bottom).
Join thousands of other readers and subscribe to our blog.