In this article we explore research, academic insights, and the questions pertaining to momentum as a separate risk factor.
Factor Momentum and the Momentum Factor
- Sina Ehsani and Juhani T. Linnainmaa
- Journal of Finance
- A version of this paper can be found here
- Want to read our summaries of academic finance papers? Check out our Academic Research Insight category.
What are the research questions?
Breaking new ground, the authors present a novel view on the nature and source of “momentum” that differs from our current understanding of momentum, whether it be industry momentum, residual, or any other version of momentum. Explanations of the source of profitability for momentum strategies have traditionally relied on behavioral biases on the part of investors, time-varying risk premiums, or trading frictions. The research presented here maintains that factor momentum is not separate and distinct from other factors, but is primarily associated with the timing of other factors. Profits from factor momentum can be captured by a strategy that times other factors.
What are the Academic Insights?
The analysis proceeds through a number of steps.
1. The prior returns of factors provide information about their future returns. The average return for the 20 factors studied was 51 bps monthly when the previous year produced positive returns. If the previous year’s returns were negative, the average dropped to 6 bps, a significant difference. The factors tested were typical “off-the-shelf” factors and have been published in academic journals.
2. Factor returns are autocorrelated due to the strength and persistence of investor sentiment. If that sentiment-driven demand is sufficiently persistent it will affect asset prices in a predictable manner. Although the arbitrage opportunity does present itself, but arbitrage trading around it is insufficiently aggressive to eliminate excess profitability. This provides the foundation for arguing that factor momentum is the aggregate of the autocorrelations of other factors. The profitability of momentum strategies is best described as the result of a “bet” on the autocorrelations in factor returns.
3. The momentum observed in factor returns is relayed to factors that explain the largest portion of the cross-section of returns. The portion size depends on dispersion in factor exposures. The larger the dispersion of exposures across securities and asset classes, the larger the portion factor momentum shows up in individual security returns. That notion is at the center of the main research hypothesis in this paper: Is security level momentum subsumed by the momentum in factor level returns?
4. “Do individual security returns display momentum beyond that due to factor returns?” Well…No.
To address this question directly, the authors employ trading strategies that pit individual stock momentum with factor momentum and test for excess returns (t-tests on the intercept) against the Fama-French 5 factor risk model. Measures of stock momentum and factor momentum included those listed below.
Measures of individual stock momentum
- Standard moment from Jegadeesh and Titman (1993)
- Industry-adjusted moment from Cohen and Polk (1998)
- Industry momentum from Moskowitz and Grinblatt (1999)
- Intermediate momentum from Novy-Marx (2012)
- Sharpe ratio momentum from Rachev et al. (2007)
Measures of factor momentum
- Momentum in individual factor returns
- Momentum in principal component (PC) factors
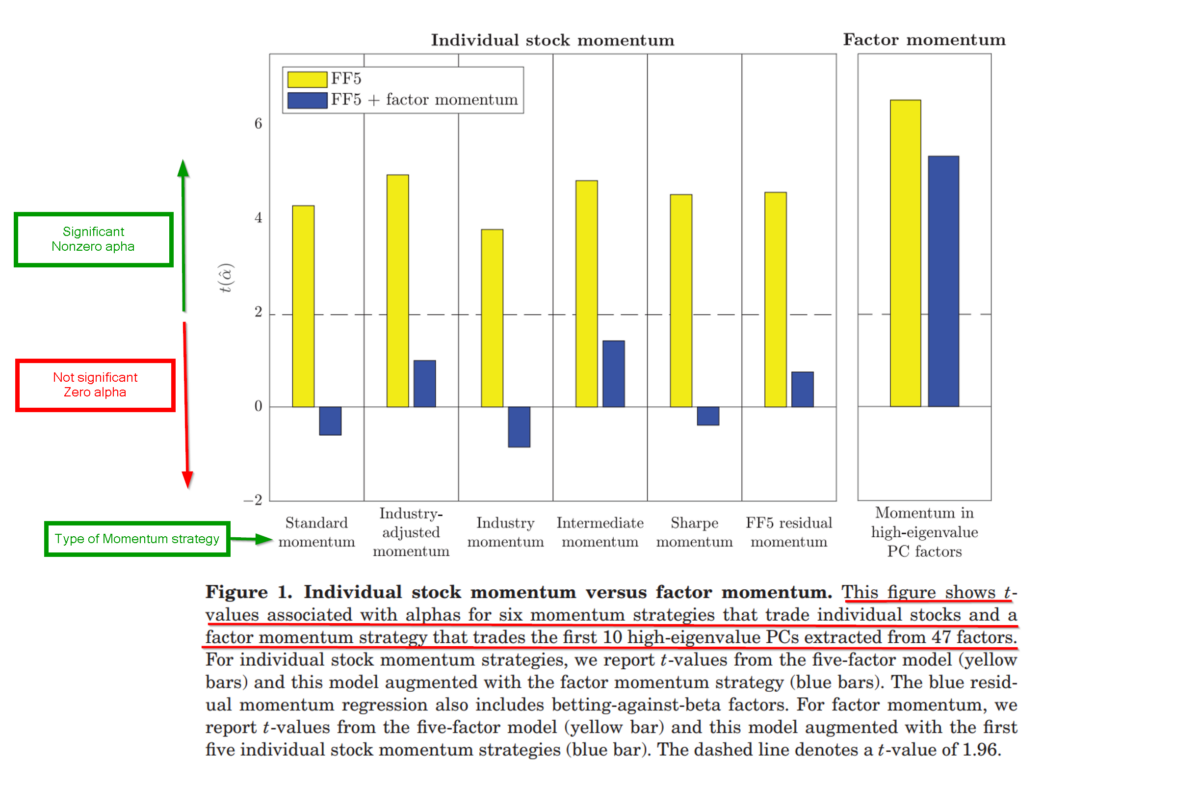
The empirical results are presented in Figure 1. On the left side of the figure, you will find the results of the 5 stock momentum strategies with accompanying estimates of excess returns and profitability while controlling for the FF risk factors. This shows up in the statistical significance of the intercept of the regression reported on the vertical axis. Anything above 2.0 is significant and indicates the stock momentum strategy produced positive excess returns. Anything below -2.0 is also significant, although negative. The strategy produced negative excess returns. Anything in-between indicates there were no excess returns, positive or negative. The results are pretty clear–factor momentum subsumes stock momentum. On the left side, you see the results (yellow bars) of the excess returns associated with the individual stock strategy. All are positive and significant. However, when a measure of factor momentum is added to the mix, the excess returns (blue bars) are not distinguishable from zero (blue bars). On the right side, the results of the momentum factor strategy are presented. The t-tests remain positive and significant. Recall that the factor momentum strategy is one in which an investment is made in any factor that has done well in the recent past and the stocks that have high exposures to those factors. An effective factor timing approach.
Why does the question of momentum as a separate factor matter?
The authors argue that the pervasiveness of momentum across time and asset classes leads us to mistakenly believe that it is an independent and static factor. Instead of being unrelated to other factors, they argue that momentum is dynamically related to all of them. Stocks with high momentum covary due to their common exposures to the same systematic factors. Positive momentum stocks load on factors that have done well recently and negative momentum stocks load on factors that have performed poorly. Aggregate the momentum observed across the factors and you have Factor Momentum. Although the tests of factor risk models (Fama/French, Carhart, etc.) that are static in nature simply provide evidence that momentum is not explained by other factors, it would be inaccurate to say that it is a distinct risk factor on its own. Indeed, it appears that there is factor momentum but not a momentum factor.
The most important chart from the paper
Abstract
Momentum in individual stock returns relates to momentum in factor returns. Most factors are positively autocorrelated: the average factor earns a monthly return of six basis points following a year of losses and 51 basis points following a positive year. We find that factor momentum concentrates in factors that explain more of the cross section of returns and that it is not incidental to individual stock momentum: momentum-neutral factors display more momentum. Momentum found in higheigenvalue principal component factors subsumes most forms of individual stock momentum. Our results suggest that momentum is not a distinct risk factor—it times other factors.
About the Author: Tommi Johnsen, PhD
—
Important Disclosures
For informational and educational purposes only and should not be construed as specific investment, accounting, legal, or tax advice. Certain information is deemed to be reliable, but its accuracy and completeness cannot be guaranteed. Third party information may become outdated or otherwise superseded without notice. Neither the Securities and Exchange Commission (SEC) nor any other federal or state agency has approved, determined the accuracy, or confirmed the adequacy of this article.
The views and opinions expressed herein are those of the author and do not necessarily reflect the views of Alpha Architect, its affiliates or its employees. Our full disclosures are available here. Definitions of common statistics used in our analysis are available here (towards the bottom).
Join thousands of other readers and subscribe to our blog.